Immigrants from Cabo Verde vs Immigrants from Ukraine Disability Age 65 to 74

COMPARE

Immigrants from Cabo Verde
Race
Ancestry
AfghanAfricanAlaska NativeAlaskan AthabascanAlbanianAleutAlsatianAmericanApacheArabArapahoArgentineanArmenianAssyrian/Chaldean/SyriacAustralianAustrianBahamianBangladeshiBarbadianBasqueBelgianBelizeanBermudanBhutaneseBlackfeetBolivianBrazilianBritishBritish West IndianBulgarianBurmeseCajunCambodianCanadianCape VerdeanCarpatho RusynCelticCentral AmericanCentral American IndianCherokeeCheyenneChickasawChileanChineseChippewaChoctawColombianColvilleComancheCosta RicanCreeCreekCroatianCrowCubanCypriotCzechCzechoslovakianDanishDelawareDominicanDutchDutch West IndianEastern EuropeanEcuadorianEgyptianEnglishEstonianEthiopianEuropeanFijianFilipinoFinnishFrenchFrench American IndianFrench CanadianGermanGerman RussianGhanaianGreekGuamanian/ChamorroGuatemalanGuyaneseHaitianHmongHonduranHopiHoumaHungarianIcelanderIndian (Asian)IndonesianInupiatIranianIraqiIrishIroquoisIsraeliItalianJamaicanJapaneseJordanianKenyanKiowaKoreanLaotianLatvianLebaneseLiberianLithuanianLumbeeLuxembourgerMacedonianMalaysianMalteseMarshalleseMenomineeMexicanMexican American IndianMongolianMoroccanNative HawaiianNavajoNepaleseNew ZealanderNicaraguanNigerianNorthern EuropeanNorwegianOkinawanOsageOttawaPaiutePakistaniPalestinianPanamanianParaguayanPennsylvania GermanPeruvianPimaPolishPortuguesePotawatomiPuebloPuerto RicanPuget Sound SalishRomanianRussianSalvadoranSamoanScandinavianScotch-IrishScottishSeminoleSenegaleseSerbianShoshoneSierra LeoneanSiouxSlavicSlovakSloveneSomaliSouth AfricanSouth AmericanSouth American IndianSoviet UnionSpaniardSpanishSpanish AmericanSpanish American IndianSri LankanSubsaharan AfricanSudaneseSwedishSwissSyrianTaiwaneseThaiTlingit-HaidaTohono O'OdhamTonganTrinidadian and TobagonianTsimshianTurkishU.S. Virgin IslanderUgandanUkrainianUruguayanUteVenezuelanVietnameseWelshWest IndianYakamaYaquiYugoslavianYumanYup'ikZimbabwean
Immigration
NonimmigrantsImmigrantsAfghanistanAfricaAlbaniaArgentinaArmeniaAsiaAustraliaAustriaBahamasBangladeshBarbadosBelarusBelgiumBelizeBoliviaBosnia and HerzegovinaBrazilBulgariaBurma/MyanmarCabo VerdeCambodiaCameroonCanadaCaribbeanCentral AmericaChileChinaColombiaCongoCosta RicaCroatiaCubaCzechoslovakiaDenmarkDominicaDominican RepublicEastern AfricaEastern AsiaEastern EuropeEcuadorEgyptEl SalvadorEnglandEritreaEthiopiaEuropeFijiFranceGermanyGhanaGreeceGrenadaGuatemalaGuyanaHaitiHondurasHong KongHungaryIndiaIndonesiaIranIraqIrelandIsraelItalyJamaicaJapanJordanKazakhstanKenyaKoreaKuwaitLaosLatin AmericaLatviaLebanonLiberiaLithuaniaMalaysiaMexicoMicronesiaMiddle AfricaMoldovaMoroccoNepalNetherlandsNicaraguaNigeriaNorth AmericaNorth MacedoniaNorthern AfricaNorthern EuropeNorwayOceaniaPakistanPanamaPeruPhilippinesPolandPortugalRomaniaRussiaSaudi ArabiaScotlandSenegalSerbiaSierra LeoneSingaporeSomaliaSouth AfricaSouth AmericaSouth Central AsiaSouth Eastern AsiaSouthern EuropeSpainSri LankaSt. Vincent and the GrenadinesSudanSwedenSwitzerlandSyriaTaiwanThailandTrinidad and TobagoTurkeyUgandaUruguayUzbekistanVenezuelaVietnamWest IndiesWestern AfricaWestern AsiaWestern EuropeYemenZaireZimbabweAzores
Immigrants from Ukraine
Race
Ancestry
AfghanAfricanAlaska NativeAlaskan AthabascanAlbanianAleutAlsatianAmericanApacheArabArapahoArgentineanArmenianAssyrian/Chaldean/SyriacAustralianAustrianBahamianBangladeshiBarbadianBasqueBelgianBelizeanBermudanBhutaneseBlackfeetBolivianBrazilianBritishBritish West IndianBulgarianBurmeseCajunCambodianCanadianCape VerdeanCarpatho RusynCelticCentral AmericanCentral American IndianCherokeeCheyenneChickasawChileanChineseChippewaChoctawColombianColvilleComancheCosta RicanCreeCreekCroatianCrowCubanCypriotCzechCzechoslovakianDanishDelawareDominicanDutchDutch West IndianEastern EuropeanEcuadorianEgyptianEnglishEstonianEthiopianEuropeanFijianFilipinoFinnishFrenchFrench American IndianFrench CanadianGermanGerman RussianGhanaianGreekGuamanian/ChamorroGuatemalanGuyaneseHaitianHmongHonduranHopiHoumaHungarianIcelanderIndian (Asian)IndonesianInupiatIranianIraqiIrishIroquoisIsraeliItalianJamaicanJapaneseJordanianKenyanKiowaKoreanLaotianLatvianLebaneseLiberianLithuanianLumbeeLuxembourgerMacedonianMalaysianMalteseMarshalleseMenomineeMexicanMexican American IndianMongolianMoroccanNative HawaiianNavajoNepaleseNew ZealanderNicaraguanNigerianNorthern EuropeanNorwegianOkinawanOsageOttawaPaiutePakistaniPalestinianPanamanianParaguayanPennsylvania GermanPeruvianPimaPolishPortuguesePotawatomiPuebloPuerto RicanPuget Sound SalishRomanianRussianSalvadoranSamoanScandinavianScotch-IrishScottishSeminoleSenegaleseSerbianShoshoneSierra LeoneanSiouxSlavicSlovakSloveneSomaliSouth AfricanSouth AmericanSouth American IndianSoviet UnionSpaniardSpanishSpanish AmericanSpanish American IndianSri LankanSubsaharan AfricanSudaneseSwedishSwissSyrianTaiwaneseThaiTlingit-HaidaTohono O'OdhamTonganTrinidadian and TobagonianTsimshianTurkishU.S. Virgin IslanderUgandanUkrainianUruguayanUteVenezuelanVietnameseWelshWest IndianYakamaYaquiYugoslavianYumanYup'ikZimbabwean
Immigration
NonimmigrantsImmigrantsAfghanistanAfricaAlbaniaArgentinaArmeniaAsiaAustraliaAustriaBahamasBangladeshBarbadosBelarusBelgiumBelizeBoliviaBosnia and HerzegovinaBrazilBulgariaBurma/MyanmarCambodiaCameroonCanadaCaribbeanCentral AmericaChileChinaColombiaCongoCosta RicaCroatiaCubaCzechoslovakiaDenmarkDominicaDominican RepublicEastern AfricaEastern AsiaEastern EuropeEcuadorEgyptEl SalvadorEnglandEritreaEthiopiaEuropeFijiFranceGermanyGhanaGreeceGrenadaGuatemalaGuyanaHaitiHondurasHong KongHungaryIndiaIndonesiaIranIraqIrelandIsraelItalyJamaicaJapanJordanKazakhstanKenyaKoreaKuwaitLaosLatin AmericaLatviaLebanonLiberiaLithuaniaMalaysiaMexicoMicronesiaMiddle AfricaMoldovaMoroccoNepalNetherlandsNicaraguaNigeriaNorth AmericaNorth MacedoniaNorthern AfricaNorthern EuropeNorwayOceaniaPakistanPanamaPeruPhilippinesPolandPortugalRomaniaRussiaSaudi ArabiaScotlandSenegalSerbiaSierra LeoneSingaporeSomaliaSouth AfricaSouth AmericaSouth Central AsiaSouth Eastern AsiaSouthern EuropeSpainSri LankaSt. Vincent and the GrenadinesSudanSwedenSwitzerlandSyriaTaiwanThailandTrinidad and TobagoTurkeyUgandaUkraineUruguayUzbekistanVenezuelaVietnamWest IndiesWestern AfricaWestern AsiaWestern EuropeYemenZaireZimbabweAzores
Disability Age 65 to 74
Income
Poverty
Unemployment
Labor Participation
Family Structure
Vehicle Availability
Education Level
Disability

Disability Age 65 to 74 Comparison

Immigrants from Cabo Verde

Immigrants from Ukraine

Tragic
Excellent
26.3%
DISABILITY AGE 65 TO 74
0.0/ 100
METRIC RATING
290th/ 347
METRIC RANK
22.6%
DISABILITY AGE 65 TO 74
88.4/ 100
METRIC RATING
135th/ 347
METRIC RANK

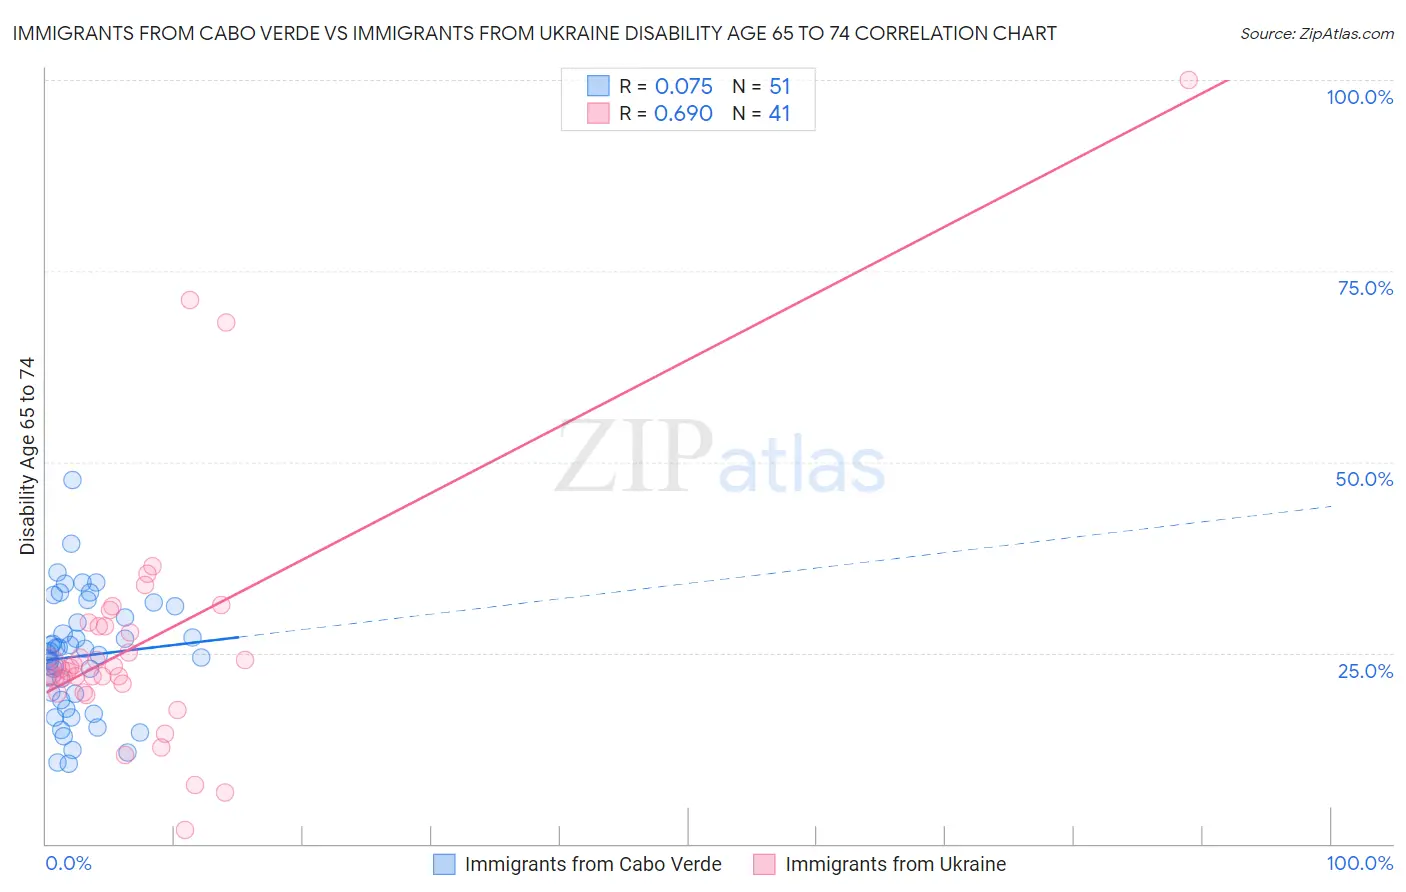
Immigrants from Cabo Verde vs Immigrants from Ukraine Disability Age 65 to 74 Correlation Chart

The statistical analysis conducted on geographies consisting of 38,130,720 people shows a slight positive correlation between the proportion of Immigrants from Cabo Verde and percentage of population with a disability between the ages 65 and 75 in the United States with a correlation coefficient (R) of 0.075 and weighted average of 26.3%. Similarly, the statistical analysis conducted on geographies consisting of 289,367,619 people shows a significant positive correlation between the proportion of Immigrants from Ukraine and percentage of population with a disability between the ages 65 and 75 in the United States with a correlation coefficient (R) of 0.690 and weighted average of 22.6%, a difference of 16.2%.
Immigrants from Cabo Verde vs Immigrants from Ukraine Disability Age 65 to 74

Disability Age 65 to 74 Correlation Summary

MeasurementImmigrants from Cabo VerdeImmigrants from Ukraine
Minimum10.4%1.9%
Maximum47.6%100.0%
Range37.2%98.1%
Mean24.6%26.7%
Median24.8%23.2%
Interquartile 25% (IQ1)18.9%20.3%
Interquartile 75% (IQ3)29.6%28.8%
Interquartile Range (IQR)10.8%8.4%
Standard Deviation (Sample)7.8%17.2%
Standard Deviation (Population)7.7%17.0%

Similar Demographics by Disability Age 65 to 74

Demographics Similar to Immigrants from Cabo Verde by Disability Age 65 to 74

In terms of disability age 65 to 74, the demographic groups most similar to Immigrants from Cabo Verde are Spanish American Indian (26.4%, a difference of 0.20%), African (26.2%, a difference of 0.31%), Mexican American Indian (26.2%, a difference of 0.62%), Immigrants from Laos (26.1%, a difference of 0.72%), and Immigrants from Micronesia (26.1%, a difference of 0.78%).
DemographicsRating | RankDisability Age 65 to 74
Spanish Americans
0.0
/100
|
#283
Tragic
25.9%
Immigrants | Azores
0.0
/100
|
#284
Tragic
26.0%
Immigrants | Congo
0.0
/100
|
#285
Tragic
26.0%
Immigrants | Micronesia
0.0
/100
|
#286
Tragic
26.1%
Immigrants | Laos
0.0
/100
|
#287
Tragic
26.1%
Mexican American Indians
0.0
/100
|
#288
Tragic
26.2%
Africans
0.0
/100
|
#289
Tragic
26.2%
Immigrants | Cabo Verde
0.0
/100
|
#290
Tragic
26.3%
Spanish American Indians
0.0
/100
|
#291
Tragic
26.4%
Blackfeet
0.0
/100
|
#292
Tragic
26.6%
Immigrants | Central America
0.0
/100
|
#293
Tragic
26.6%
Dominicans
0.0
/100
|
#294
Tragic
26.7%
Hispanics or Latinos
0.0
/100
|
#295
Tragic
26.7%
Bangladeshis
0.0
/100
|
#296
Tragic
26.8%
Fijians
0.0
/100
|
#297
Tragic
27.0%

Demographics Similar to Immigrants from Ukraine by Disability Age 65 to 74

In terms of disability age 65 to 74, the demographic groups most similar to Immigrants from Ukraine are Afghan (22.6%, a difference of 0.030%), Ethiopian (22.7%, a difference of 0.070%), Northern European (22.6%, a difference of 0.080%), Taiwanese (22.7%, a difference of 0.10%), and Costa Rican (22.6%, a difference of 0.13%).
DemographicsRating | RankDisability Age 65 to 74
Immigrants | Costa Rica
90.4
/100
|
#128
Exceptional
22.6%
Immigrants | Uruguay
90.1
/100
|
#129
Exceptional
22.6%
Immigrants | Albania
90.0
/100
|
#130
Excellent
22.6%
Immigrants | Nepal
89.4
/100
|
#131
Excellent
22.6%
Costa Ricans
89.2
/100
|
#132
Excellent
22.6%
Northern Europeans
88.9
/100
|
#133
Excellent
22.6%
Afghans
88.6
/100
|
#134
Excellent
22.6%
Immigrants | Ukraine
88.4
/100
|
#135
Excellent
22.6%
Ethiopians
87.9
/100
|
#136
Excellent
22.7%
Taiwanese
87.6
/100
|
#137
Excellent
22.7%
Immigrants | Moldova
87.3
/100
|
#138
Excellent
22.7%
Immigrants | Syria
85.8
/100
|
#139
Excellent
22.7%
Ugandans
85.4
/100
|
#140
Excellent
22.7%
Belgians
85.3
/100
|
#141
Excellent
22.7%
Immigrants | Ethiopia
85.3
/100
|
#142
Excellent
22.7%