Barbadian vs Swedish Disability Age 35 to 64
COMPARE
Barbadian
Swedish
Disability Age 35 to 64
Disability Age 35 to 64 Comparison
Barbadians
Swedes
11.8%
DISABILITY AGE 35 TO 64
9.5/ 100
METRIC RATING
217th/ 347
METRIC RANK
11.4%
DISABILITY AGE 35 TO 64
31.3/ 100
METRIC RATING
191st/ 347
METRIC RANK
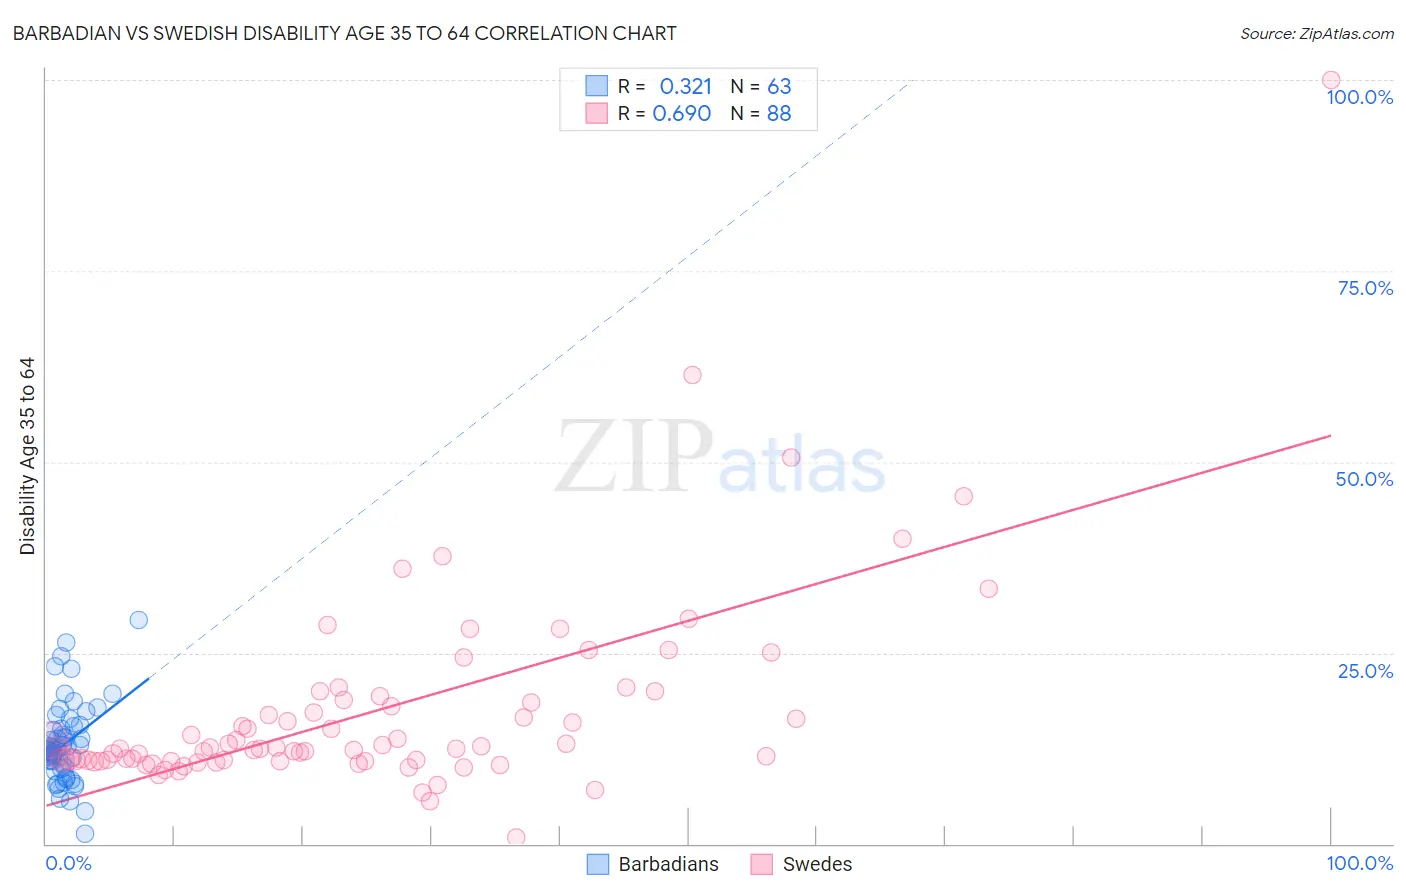
Barbadian vs Swedish Disability Age 35 to 64 Correlation Chart
The statistical analysis conducted on geographies consisting of 141,271,675 people shows a mild positive correlation between the proportion of Barbadians and percentage of population with a disability between the ages 34 and 64 in the United States with a correlation coefficient (R) of 0.321 and weighted average of 11.8%. Similarly, the statistical analysis conducted on geographies consisting of 538,454,121 people shows a significant positive correlation between the proportion of Swedes and percentage of population with a disability between the ages 34 and 64 in the United States with a correlation coefficient (R) of 0.690 and weighted average of 11.4%, a difference of 2.9%.
Disability Age 35 to 64 Correlation Summary
| Measurement | Barbadian | Swedish |
| Minimum | 1.4% | 0.77% |
| Maximum | 29.3% | 100.0% |
| Range | 27.9% | 99.2% |
| Mean | 13.0% | 17.3% |
| Median | 12.2% | 12.5% |
| Interquartile 25% (IQ1) | 9.9% | 10.9% |
| Interquartile 75% (IQ3) | 15.1% | 18.6% |
| Interquartile Range (IQR) | 5.2% | 7.7% |
| Standard Deviation (Sample) | 5.1% | 13.3% |
| Standard Deviation (Population) | 5.1% | 13.3% |
Similar Demographics by Disability Age 35 to 64
Demographics Similar to Barbadians by Disability Age 35 to 64
In terms of disability age 35 to 64, the demographic groups most similar to Barbadians are Immigrants from Bahamas (11.8%, a difference of 0.050%), Czechoslovakian (11.8%, a difference of 0.10%), Immigrants from West Indies (11.8%, a difference of 0.14%), Alsatian (11.8%, a difference of 0.23%), and Honduran (11.8%, a difference of 0.25%).
| Demographics | Rating | Rank | Disability Age 35 to 64 |
| Belgians | 13.1 /100 | #210 | Poor 11.7% |
| Canadians | 13.0 /100 | #211 | Poor 11.7% |
| Immigrants | Jamaica | 11.8 /100 | #212 | Poor 11.7% |
| Yugoslavians | 11.6 /100 | #213 | Poor 11.7% |
| Immigrants | Sudan | 11.4 /100 | #214 | Poor 11.7% |
| Spanish American Indians | 11.1 /100 | #215 | Poor 11.7% |
| Bahamians | 10.7 /100 | #216 | Poor 11.8% |
| Barbadians | 9.5 /100 | #217 | Tragic 11.8% |
| Immigrants | Bahamas | 9.2 /100 | #218 | Tragic 11.8% |
| Czechoslovakians | 9.0 /100 | #219 | Tragic 11.8% |
| Immigrants | West Indies | 8.9 /100 | #220 | Tragic 11.8% |
| Alsatians | 8.5 /100 | #221 | Tragic 11.8% |
| Hondurans | 8.4 /100 | #222 | Tragic 11.8% |
| Immigrants | Honduras | 8.4 /100 | #223 | Tragic 11.8% |
| Immigrants | Ghana | 7.8 /100 | #224 | Tragic 11.8% |
Demographics Similar to Swedes by Disability Age 35 to 64
In terms of disability age 35 to 64, the demographic groups most similar to Swedes are Immigrants from Nigeria (11.4%, a difference of 0.11%), Norwegian (11.5%, a difference of 0.15%), Immigrants from Africa (11.5%, a difference of 0.22%), Hungarian (11.4%, a difference of 0.30%), and Northern European (11.4%, a difference of 0.32%).
| Demographics | Rating | Rank | Disability Age 35 to 64 |
| Kenyans | 39.2 /100 | #184 | Fair 11.4% |
| Danes | 36.8 /100 | #185 | Fair 11.4% |
| Slovenes | 36.6 /100 | #186 | Fair 11.4% |
| Immigrants | Bosnia and Herzegovina | 35.2 /100 | #187 | Fair 11.4% |
| Northern Europeans | 34.9 /100 | #188 | Fair 11.4% |
| Hungarians | 34.6 /100 | #189 | Fair 11.4% |
| Immigrants | Nigeria | 32.5 /100 | #190 | Fair 11.4% |
| Swedes | 31.3 /100 | #191 | Fair 11.4% |
| Norwegians | 29.7 /100 | #192 | Fair 11.5% |
| Immigrants | Africa | 29.0 /100 | #193 | Fair 11.5% |
| Immigrants | Latin America | 27.5 /100 | #194 | Fair 11.5% |
| Carpatho Rusyns | 25.3 /100 | #195 | Fair 11.5% |
| Iraqis | 24.2 /100 | #196 | Fair 11.5% |
| Immigrants | Iraq | 21.0 /100 | #197 | Fair 11.6% |
| Immigrants | Panama | 20.4 /100 | #198 | Fair 11.6% |