Subsaharan African vs Swedish Disability Age 35 to 64
COMPARE
Subsaharan African
Swedish
Disability Age 35 to 64
Disability Age 35 to 64 Comparison
Sub-Saharan Africans
Swedes
12.6%
DISABILITY AGE 35 TO 64
0.2/ 100
METRIC RATING
267th/ 347
METRIC RANK
11.4%
DISABILITY AGE 35 TO 64
31.3/ 100
METRIC RATING
191st/ 347
METRIC RANK
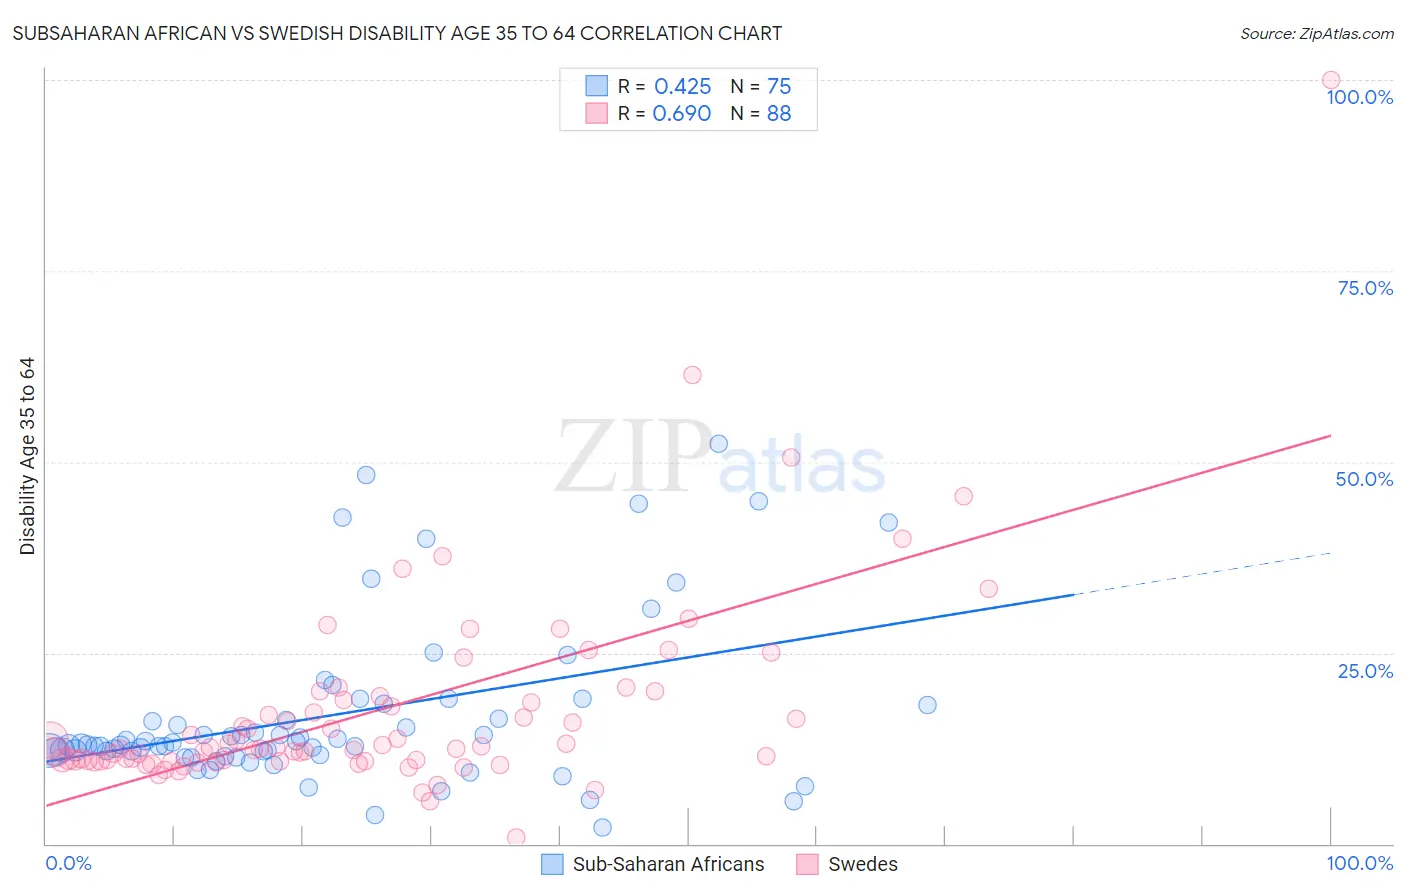
Subsaharan African vs Swedish Disability Age 35 to 64 Correlation Chart
The statistical analysis conducted on geographies consisting of 507,479,662 people shows a moderate positive correlation between the proportion of Sub-Saharan Africans and percentage of population with a disability between the ages 34 and 64 in the United States with a correlation coefficient (R) of 0.425 and weighted average of 12.6%. Similarly, the statistical analysis conducted on geographies consisting of 538,454,121 people shows a significant positive correlation between the proportion of Swedes and percentage of population with a disability between the ages 34 and 64 in the United States with a correlation coefficient (R) of 0.690 and weighted average of 11.4%, a difference of 10.4%.
Disability Age 35 to 64 Correlation Summary
| Measurement | Subsaharan African | Swedish |
| Minimum | 2.2% | 0.77% |
| Maximum | 52.4% | 100.0% |
| Range | 50.2% | 99.2% |
| Mean | 16.8% | 17.3% |
| Median | 12.9% | 12.5% |
| Interquartile 25% (IQ1) | 11.6% | 10.9% |
| Interquartile 75% (IQ3) | 18.2% | 18.6% |
| Interquartile Range (IQR) | 6.5% | 7.7% |
| Standard Deviation (Sample) | 10.7% | 13.3% |
| Standard Deviation (Population) | 10.7% | 13.3% |
Similar Demographics by Disability Age 35 to 64
Demographics Similar to Sub-Saharan Africans by Disability Age 35 to 64
In terms of disability age 35 to 64, the demographic groups most similar to Sub-Saharan Africans are White/Caucasian (12.6%, a difference of 0.16%), Immigrants from Dominica (12.7%, a difference of 0.18%), Spanish (12.7%, a difference of 0.28%), French (12.7%, a difference of 0.33%), and Marshallese (12.5%, a difference of 0.86%).
| Demographics | Rating | Rank | Disability Age 35 to 64 |
| German Russians | 0.5 /100 | #260 | Tragic 12.5% |
| Malaysians | 0.5 /100 | #261 | Tragic 12.5% |
| Senegalese | 0.5 /100 | #262 | Tragic 12.5% |
| Immigrants | Zaire | 0.4 /100 | #263 | Tragic 12.5% |
| Immigrants | Portugal | 0.4 /100 | #264 | Tragic 12.5% |
| Marshallese | 0.4 /100 | #265 | Tragic 12.5% |
| Whites/Caucasians | 0.3 /100 | #266 | Tragic 12.6% |
| Sub-Saharan Africans | 0.2 /100 | #267 | Tragic 12.6% |
| Immigrants | Dominica | 0.2 /100 | #268 | Tragic 12.7% |
| Spanish | 0.2 /100 | #269 | Tragic 12.7% |
| French | 0.2 /100 | #270 | Tragic 12.7% |
| Nepalese | 0.1 /100 | #271 | Tragic 12.8% |
| U.S. Virgin Islanders | 0.1 /100 | #272 | Tragic 12.8% |
| Pennsylvania Germans | 0.1 /100 | #273 | Tragic 12.8% |
| Celtics | 0.1 /100 | #274 | Tragic 12.9% |
Demographics Similar to Swedes by Disability Age 35 to 64
In terms of disability age 35 to 64, the demographic groups most similar to Swedes are Immigrants from Nigeria (11.4%, a difference of 0.11%), Norwegian (11.5%, a difference of 0.15%), Immigrants from Africa (11.5%, a difference of 0.22%), Hungarian (11.4%, a difference of 0.30%), and Northern European (11.4%, a difference of 0.32%).
| Demographics | Rating | Rank | Disability Age 35 to 64 |
| Kenyans | 39.2 /100 | #184 | Fair 11.4% |
| Danes | 36.8 /100 | #185 | Fair 11.4% |
| Slovenes | 36.6 /100 | #186 | Fair 11.4% |
| Immigrants | Bosnia and Herzegovina | 35.2 /100 | #187 | Fair 11.4% |
| Northern Europeans | 34.9 /100 | #188 | Fair 11.4% |
| Hungarians | 34.6 /100 | #189 | Fair 11.4% |
| Immigrants | Nigeria | 32.5 /100 | #190 | Fair 11.4% |
| Swedes | 31.3 /100 | #191 | Fair 11.4% |
| Norwegians | 29.7 /100 | #192 | Fair 11.5% |
| Immigrants | Africa | 29.0 /100 | #193 | Fair 11.5% |
| Immigrants | Latin America | 27.5 /100 | #194 | Fair 11.5% |
| Carpatho Rusyns | 25.3 /100 | #195 | Fair 11.5% |
| Iraqis | 24.2 /100 | #196 | Fair 11.5% |
| Immigrants | Iraq | 21.0 /100 | #197 | Fair 11.6% |
| Immigrants | Panama | 20.4 /100 | #198 | Fair 11.6% |