Yup'ik vs Peruvian Female Disability
COMPARE
Yup'ik
Peruvian
Female Disability
Female Disability Comparison
Yup'ik
Peruvians
11.6%
FEMALE DISABILITY
99.5/ 100
METRIC RATING
88th/ 347
METRIC RANK
11.3%
FEMALE DISABILITY
99.9/ 100
METRIC RATING
54th/ 347
METRIC RANK
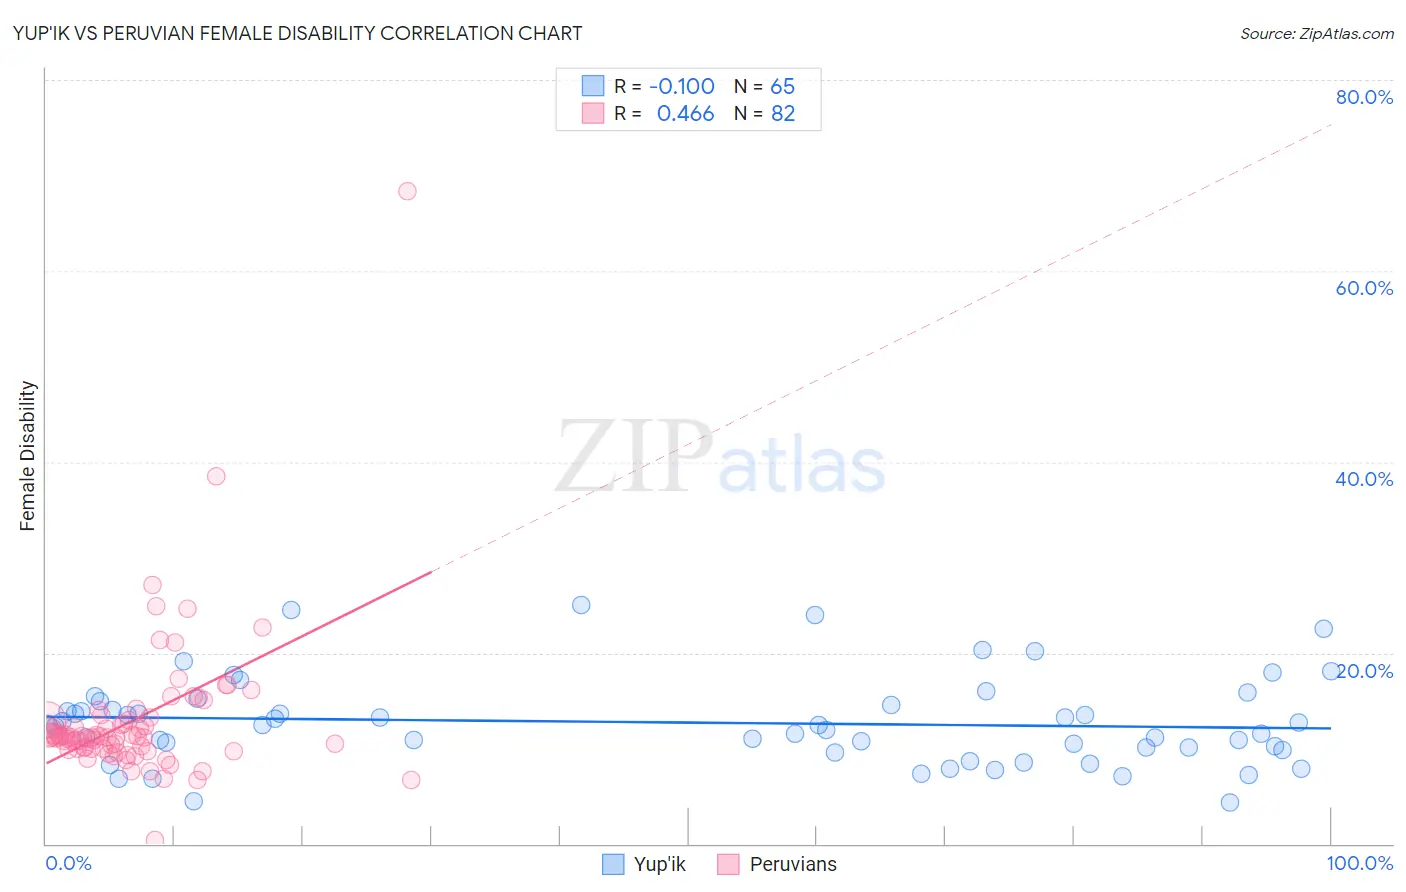
Yup'ik vs Peruvian Female Disability Correlation Chart
The statistical analysis conducted on geographies consisting of 39,957,133 people shows a slight negative correlation between the proportion of Yup'ik and percentage of females with a disability in the United States with a correlation coefficient (R) of -0.100 and weighted average of 11.6%. Similarly, the statistical analysis conducted on geographies consisting of 363,181,047 people shows a moderate positive correlation between the proportion of Peruvians and percentage of females with a disability in the United States with a correlation coefficient (R) of 0.466 and weighted average of 11.3%, a difference of 2.2%.
Female Disability Correlation Summary
| Measurement | Yup'ik | Peruvian |
| Minimum | 4.3% | 0.45% |
| Maximum | 25.0% | 68.3% |
| Range | 20.7% | 67.8% |
| Mean | 12.7% | 13.0% |
| Median | 12.3% | 11.2% |
| Interquartile 25% (IQ1) | 9.9% | 9.9% |
| Interquartile 75% (IQ3) | 14.7% | 13.0% |
| Interquartile Range (IQR) | 4.8% | 3.1% |
| Standard Deviation (Sample) | 4.6% | 8.0% |
| Standard Deviation (Population) | 4.5% | 8.0% |
Similar Demographics by Female Disability
Demographics Similar to Yup'ik by Female Disability
In terms of female disability, the demographic groups most similar to Yup'ik are Immigrants from Denmark (11.6%, a difference of 0.0%), Palestinian (11.6%, a difference of 0.070%), Immigrants from Cameroon (11.6%, a difference of 0.070%), Immigrants from Poland (11.6%, a difference of 0.10%), and Vietnamese (11.6%, a difference of 0.10%).
| Demographics | Rating | Rank | Female Disability |
| Eastern Europeans | 99.7 /100 | #81 | Exceptional 11.5% |
| Luxembourgers | 99.6 /100 | #82 | Exceptional 11.6% |
| Immigrants | Serbia | 99.6 /100 | #83 | Exceptional 11.6% |
| Immigrants | Poland | 99.6 /100 | #84 | Exceptional 11.6% |
| Palestinians | 99.6 /100 | #85 | Exceptional 11.6% |
| Immigrants | Cameroon | 99.6 /100 | #86 | Exceptional 11.6% |
| Immigrants | Denmark | 99.5 /100 | #87 | Exceptional 11.6% |
| Yup'ik | 99.5 /100 | #88 | Exceptional 11.6% |
| Vietnamese | 99.5 /100 | #89 | Exceptional 11.6% |
| Immigrants | Romania | 99.5 /100 | #90 | Exceptional 11.6% |
| Immigrants | Zimbabwe | 99.5 /100 | #91 | Exceptional 11.6% |
| Immigrants | Czechoslovakia | 99.5 /100 | #92 | Exceptional 11.6% |
| Immigrants | Sierra Leone | 99.4 /100 | #93 | Exceptional 11.6% |
| Immigrants | Brazil | 99.4 /100 | #94 | Exceptional 11.6% |
| Immigrants | Northern Europe | 99.4 /100 | #95 | Exceptional 11.6% |
Demographics Similar to Peruvians by Female Disability
In terms of female disability, the demographic groups most similar to Peruvians are Bulgarian (11.3%, a difference of 0.020%), Immigrants from Saudi Arabia (11.3%, a difference of 0.060%), Immigrants from Peru (11.3%, a difference of 0.10%), Immigrants from Belgium (11.3%, a difference of 0.22%), and Taiwanese (11.4%, a difference of 0.25%).
| Demographics | Rating | Rank | Female Disability |
| Jordanians | 100.0 /100 | #47 | Exceptional 11.3% |
| Zimbabweans | 100.0 /100 | #48 | Exceptional 11.3% |
| Tongans | 100.0 /100 | #49 | Exceptional 11.3% |
| Inupiat | 100.0 /100 | #50 | Exceptional 11.3% |
| Immigrants | Belgium | 100.0 /100 | #51 | Exceptional 11.3% |
| Immigrants | Peru | 99.9 /100 | #52 | Exceptional 11.3% |
| Immigrants | Saudi Arabia | 99.9 /100 | #53 | Exceptional 11.3% |
| Peruvians | 99.9 /100 | #54 | Exceptional 11.3% |
| Bulgarians | 99.9 /100 | #55 | Exceptional 11.3% |
| Taiwanese | 99.9 /100 | #56 | Exceptional 11.4% |
| South Americans | 99.9 /100 | #57 | Exceptional 11.4% |
| Laotians | 99.9 /100 | #58 | Exceptional 11.4% |
| Immigrants | Spain | 99.9 /100 | #59 | Exceptional 11.4% |
| Immigrants | Bulgaria | 99.9 /100 | #60 | Exceptional 11.4% |
| Immigrants | France | 99.9 /100 | #61 | Exceptional 11.4% |