Immigrants from Burma/Myanmar vs Hungarian Disability Age 18 to 34
COMPARE
Immigrants from Burma/Myanmar
Hungarian
Disability Age 18 to 34
Disability Age 18 to 34 Comparison
Immigrants from Burma/Myanmar
Hungarians
6.8%
DISABILITY AGE 18 TO 34
12.3/ 100
METRIC RATING
209th/ 347
METRIC RANK
7.1%
DISABILITY AGE 18 TO 34
0.9/ 100
METRIC RATING
245th/ 347
METRIC RANK
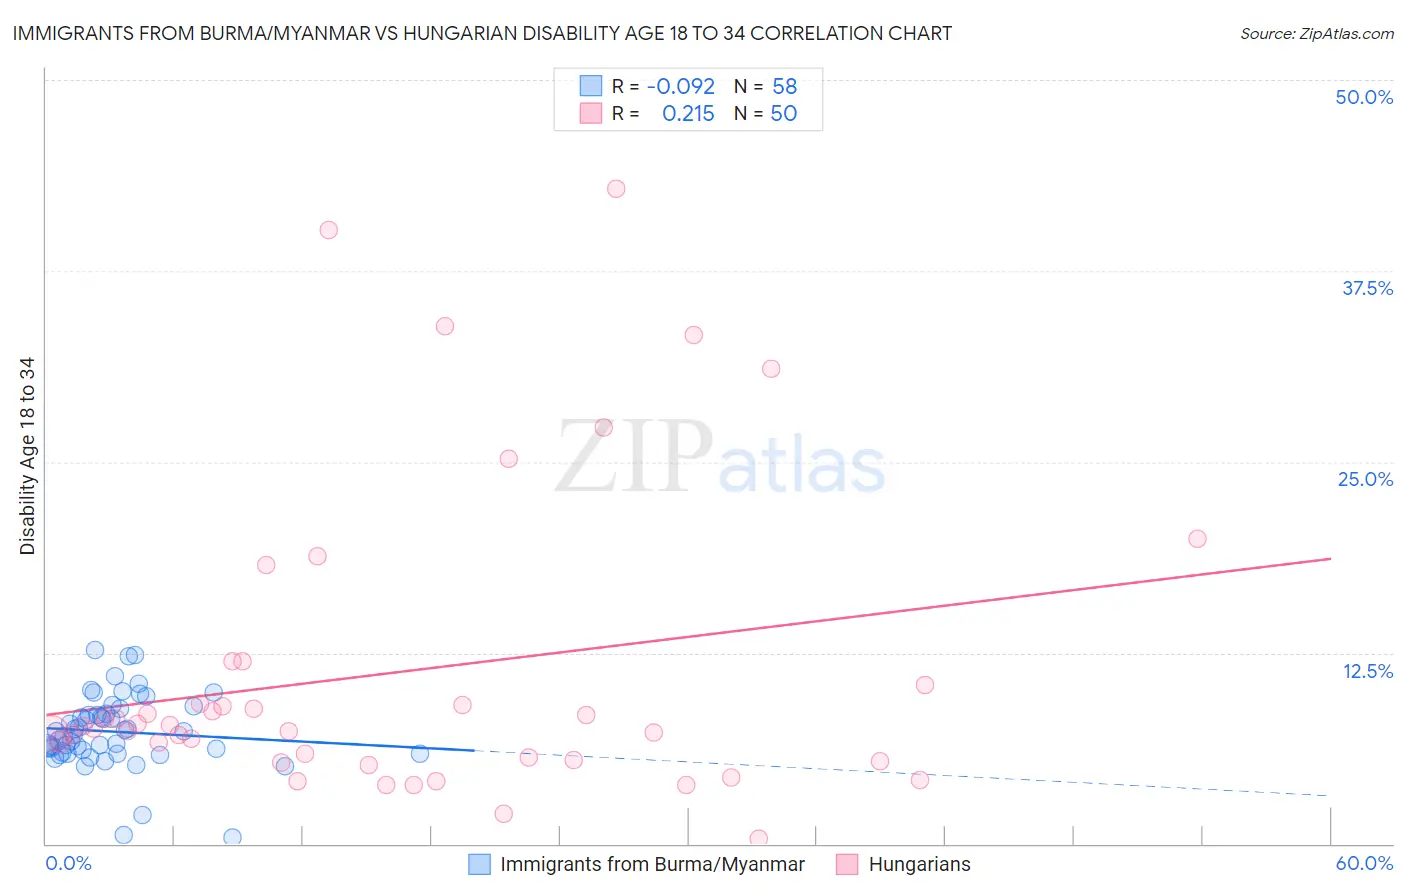
Immigrants from Burma/Myanmar vs Hungarian Disability Age 18 to 34 Correlation Chart
The statistical analysis conducted on geographies consisting of 172,278,833 people shows a slight negative correlation between the proportion of Immigrants from Burma/Myanmar and percentage of population with a disability between the ages 18 and 35 in the United States with a correlation coefficient (R) of -0.092 and weighted average of 6.8%. Similarly, the statistical analysis conducted on geographies consisting of 483,792,103 people shows a weak positive correlation between the proportion of Hungarians and percentage of population with a disability between the ages 18 and 35 in the United States with a correlation coefficient (R) of 0.215 and weighted average of 7.1%, a difference of 4.7%.
Disability Age 18 to 34 Correlation Summary
| Measurement | Immigrants from Burma/Myanmar | Hungarian |
| Minimum | 0.44% | 0.32% |
| Maximum | 12.7% | 42.9% |
| Range | 12.2% | 42.5% |
| Mean | 7.3% | 11.2% |
| Median | 7.2% | 7.6% |
| Interquartile 25% (IQ1) | 6.0% | 5.5% |
| Interquartile 75% (IQ3) | 8.5% | 10.4% |
| Interquartile Range (IQR) | 2.5% | 4.9% |
| Standard Deviation (Sample) | 2.4% | 10.0% |
| Standard Deviation (Population) | 2.4% | 9.9% |
Similar Demographics by Disability Age 18 to 34
Demographics Similar to Immigrants from Burma/Myanmar by Disability Age 18 to 34
In terms of disability age 18 to 34, the demographic groups most similar to Immigrants from Burma/Myanmar are Immigrants from Scotland (6.8%, a difference of 0.020%), Mexican (6.8%, a difference of 0.040%), Japanese (6.8%, a difference of 0.080%), Lebanese (6.8%, a difference of 0.15%), and Immigrants from Bosnia and Herzegovina (6.8%, a difference of 0.20%).
| Demographics | Rating | Rank | Disability Age 18 to 34 |
| Panamanians | 15.8 /100 | #202 | Poor 6.8% |
| Hispanics or Latinos | 13.8 /100 | #203 | Poor 6.8% |
| Immigrants | Bosnia and Herzegovina | 13.6 /100 | #204 | Poor 6.8% |
| Lebanese | 13.3 /100 | #205 | Poor 6.8% |
| Japanese | 12.8 /100 | #206 | Poor 6.8% |
| Mexicans | 12.6 /100 | #207 | Poor 6.8% |
| Immigrants | Scotland | 12.4 /100 | #208 | Poor 6.8% |
| Immigrants | Burma/Myanmar | 12.3 /100 | #209 | Poor 6.8% |
| Latvians | 11.1 /100 | #210 | Poor 6.8% |
| Immigrants | Norway | 10.0 /100 | #211 | Tragic 6.8% |
| Luxembourgers | 9.4 /100 | #212 | Tragic 6.9% |
| Immigrants | Western Europe | 9.1 /100 | #213 | Tragic 6.9% |
| Serbians | 8.2 /100 | #214 | Tragic 6.9% |
| Immigrants | Thailand | 7.5 /100 | #215 | Tragic 6.9% |
| Sudanese | 7.0 /100 | #216 | Tragic 6.9% |
Demographics Similar to Hungarians by Disability Age 18 to 34
In terms of disability age 18 to 34, the demographic groups most similar to Hungarians are Immigrants from Liberia (7.1%, a difference of 0.020%), Immigrants from Zaire (7.1%, a difference of 0.10%), Yugoslavian (7.2%, a difference of 0.17%), Guamanian/Chamorro (7.2%, a difference of 0.20%), and Malaysian (7.2%, a difference of 0.30%).
| Demographics | Rating | Rank | Disability Age 18 to 34 |
| Marshallese | 1.3 /100 | #238 | Tragic 7.1% |
| Italians | 1.2 /100 | #239 | Tragic 7.1% |
| Arapaho | 1.1 /100 | #240 | Tragic 7.1% |
| Nepalese | 1.1 /100 | #241 | Tragic 7.1% |
| Immigrants | Congo | 1.1 /100 | #242 | Tragic 7.1% |
| Icelanders | 1.0 /100 | #243 | Tragic 7.1% |
| Immigrants | Zaire | 0.9 /100 | #244 | Tragic 7.1% |
| Hungarians | 0.9 /100 | #245 | Tragic 7.1% |
| Immigrants | Liberia | 0.8 /100 | #246 | Tragic 7.1% |
| Yugoslavians | 0.8 /100 | #247 | Tragic 7.2% |
| Guamanians/Chamorros | 0.8 /100 | #248 | Tragic 7.2% |
| Malaysians | 0.7 /100 | #249 | Tragic 7.2% |
| Fijians | 0.6 /100 | #250 | Tragic 7.2% |
| Spaniards | 0.6 /100 | #251 | Tragic 7.2% |
| Poles | 0.6 /100 | #252 | Tragic 7.2% |