Immigrants from Burma/Myanmar vs Spanish Disability Age 18 to 34
COMPARE
Immigrants from Burma/Myanmar
Spanish
Disability Age 18 to 34
Disability Age 18 to 34 Comparison
Immigrants from Burma/Myanmar
Spanish
6.8%
DISABILITY AGE 18 TO 34
12.3/ 100
METRIC RATING
209th/ 347
METRIC RANK
7.5%
DISABILITY AGE 18 TO 34
0.0/ 100
METRIC RATING
282nd/ 347
METRIC RANK
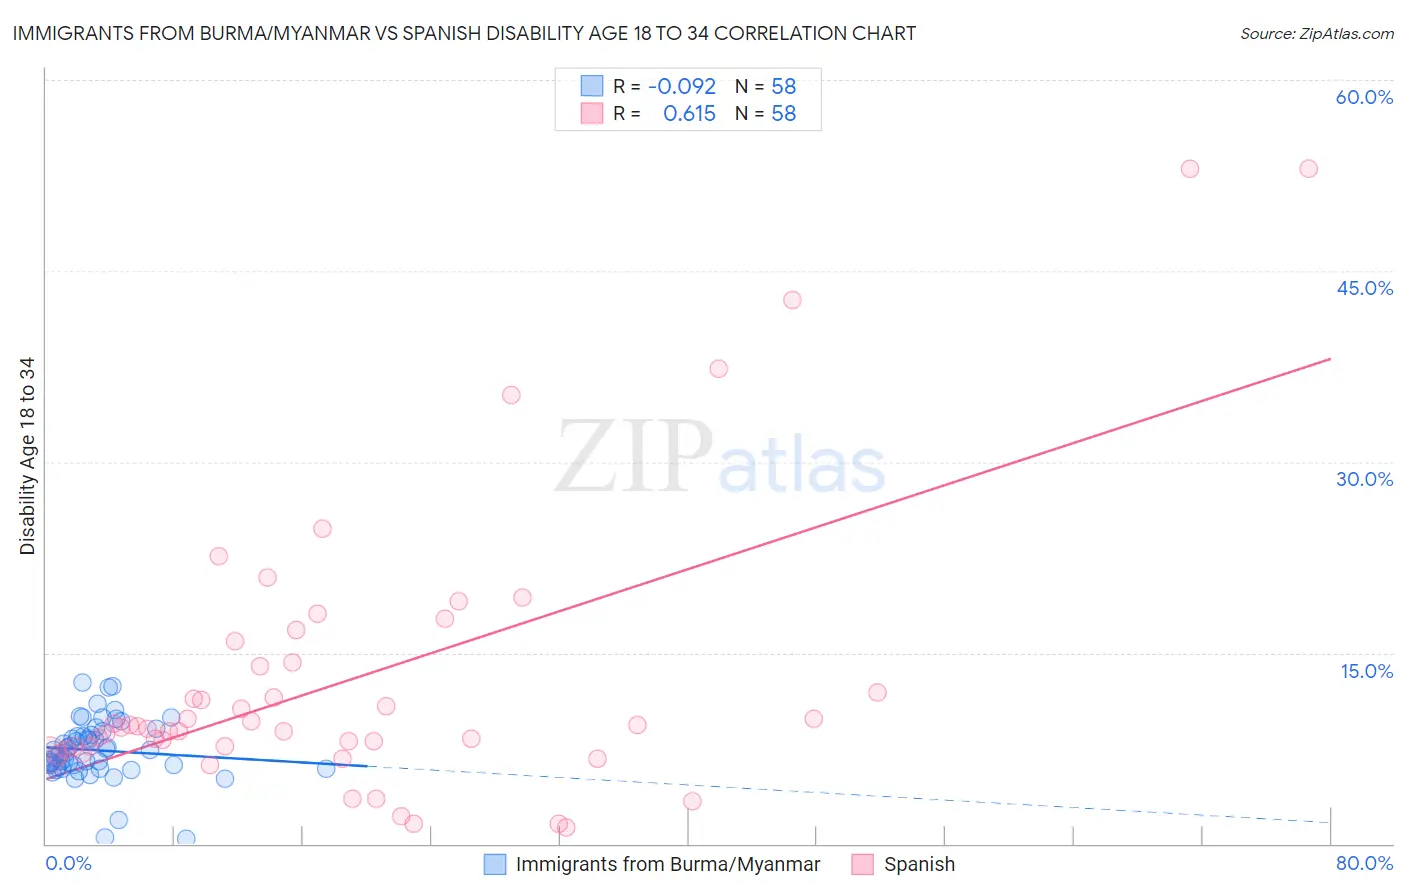
Immigrants from Burma/Myanmar vs Spanish Disability Age 18 to 34 Correlation Chart
The statistical analysis conducted on geographies consisting of 172,278,833 people shows a slight negative correlation between the proportion of Immigrants from Burma/Myanmar and percentage of population with a disability between the ages 18 and 35 in the United States with a correlation coefficient (R) of -0.092 and weighted average of 6.8%. Similarly, the statistical analysis conducted on geographies consisting of 420,890,896 people shows a significant positive correlation between the proportion of Spanish and percentage of population with a disability between the ages 18 and 35 in the United States with a correlation coefficient (R) of 0.615 and weighted average of 7.5%, a difference of 9.8%.
Disability Age 18 to 34 Correlation Summary
| Measurement | Immigrants from Burma/Myanmar | Spanish |
| Minimum | 0.44% | 1.3% |
| Maximum | 12.7% | 53.1% |
| Range | 12.2% | 51.8% |
| Mean | 7.3% | 12.9% |
| Median | 7.2% | 9.2% |
| Interquartile 25% (IQ1) | 6.0% | 7.6% |
| Interquartile 75% (IQ3) | 8.5% | 14.2% |
| Interquartile Range (IQR) | 2.5% | 6.6% |
| Standard Deviation (Sample) | 2.4% | 11.2% |
| Standard Deviation (Population) | 2.4% | 11.1% |
Similar Demographics by Disability Age 18 to 34
Demographics Similar to Immigrants from Burma/Myanmar by Disability Age 18 to 34
In terms of disability age 18 to 34, the demographic groups most similar to Immigrants from Burma/Myanmar are Immigrants from Scotland (6.8%, a difference of 0.020%), Mexican (6.8%, a difference of 0.040%), Japanese (6.8%, a difference of 0.080%), Lebanese (6.8%, a difference of 0.15%), and Immigrants from Bosnia and Herzegovina (6.8%, a difference of 0.20%).
| Demographics | Rating | Rank | Disability Age 18 to 34 |
| Panamanians | 15.8 /100 | #202 | Poor 6.8% |
| Hispanics or Latinos | 13.8 /100 | #203 | Poor 6.8% |
| Immigrants | Bosnia and Herzegovina | 13.6 /100 | #204 | Poor 6.8% |
| Lebanese | 13.3 /100 | #205 | Poor 6.8% |
| Japanese | 12.8 /100 | #206 | Poor 6.8% |
| Mexicans | 12.6 /100 | #207 | Poor 6.8% |
| Immigrants | Scotland | 12.4 /100 | #208 | Poor 6.8% |
| Immigrants | Burma/Myanmar | 12.3 /100 | #209 | Poor 6.8% |
| Latvians | 11.1 /100 | #210 | Poor 6.8% |
| Immigrants | Norway | 10.0 /100 | #211 | Tragic 6.8% |
| Luxembourgers | 9.4 /100 | #212 | Tragic 6.9% |
| Immigrants | Western Europe | 9.1 /100 | #213 | Tragic 6.9% |
| Serbians | 8.2 /100 | #214 | Tragic 6.9% |
| Immigrants | Thailand | 7.5 /100 | #215 | Tragic 6.9% |
| Sudanese | 7.0 /100 | #216 | Tragic 6.9% |
Demographics Similar to Spanish by Disability Age 18 to 34
In terms of disability age 18 to 34, the demographic groups most similar to Spanish are Danish (7.5%, a difference of 0.10%), Paiute (7.5%, a difference of 0.20%), Hopi (7.5%, a difference of 0.24%), Swedish (7.5%, a difference of 0.66%), and Czechoslovakian (7.4%, a difference of 0.69%).
| Demographics | Rating | Rank | Disability Age 18 to 34 |
| Immigrants | Somalia | 0.1 /100 | #275 | Tragic 7.4% |
| Europeans | 0.1 /100 | #276 | Tragic 7.4% |
| Immigrants | Portugal | 0.1 /100 | #277 | Tragic 7.4% |
| Lumbee | 0.1 /100 | #278 | Tragic 7.4% |
| Czechoslovakians | 0.1 /100 | #279 | Tragic 7.4% |
| Yaqui | 0.1 /100 | #280 | Tragic 7.4% |
| Paiute | 0.0 /100 | #281 | Tragic 7.5% |
| Spanish | 0.0 /100 | #282 | Tragic 7.5% |
| Danes | 0.0 /100 | #283 | Tragic 7.5% |
| Hopi | 0.0 /100 | #284 | Tragic 7.5% |
| Swedes | 0.0 /100 | #285 | Tragic 7.5% |
| Celtics | 0.0 /100 | #286 | Tragic 7.6% |
| Norwegians | 0.0 /100 | #287 | Tragic 7.6% |
| Whites/Caucasians | 0.0 /100 | #288 | Tragic 7.6% |
| Immigrants | Nonimmigrants | 0.0 /100 | #289 | Tragic 7.6% |