Central American Indian vs Hungarian Disability Age 18 to 34
COMPARE
Central American Indian
Hungarian
Disability Age 18 to 34
Disability Age 18 to 34 Comparison
Central American Indians
Hungarians
6.9%
DISABILITY AGE 18 TO 34
4.7/ 100
METRIC RATING
225th/ 347
METRIC RANK
7.1%
DISABILITY AGE 18 TO 34
0.9/ 100
METRIC RATING
245th/ 347
METRIC RANK
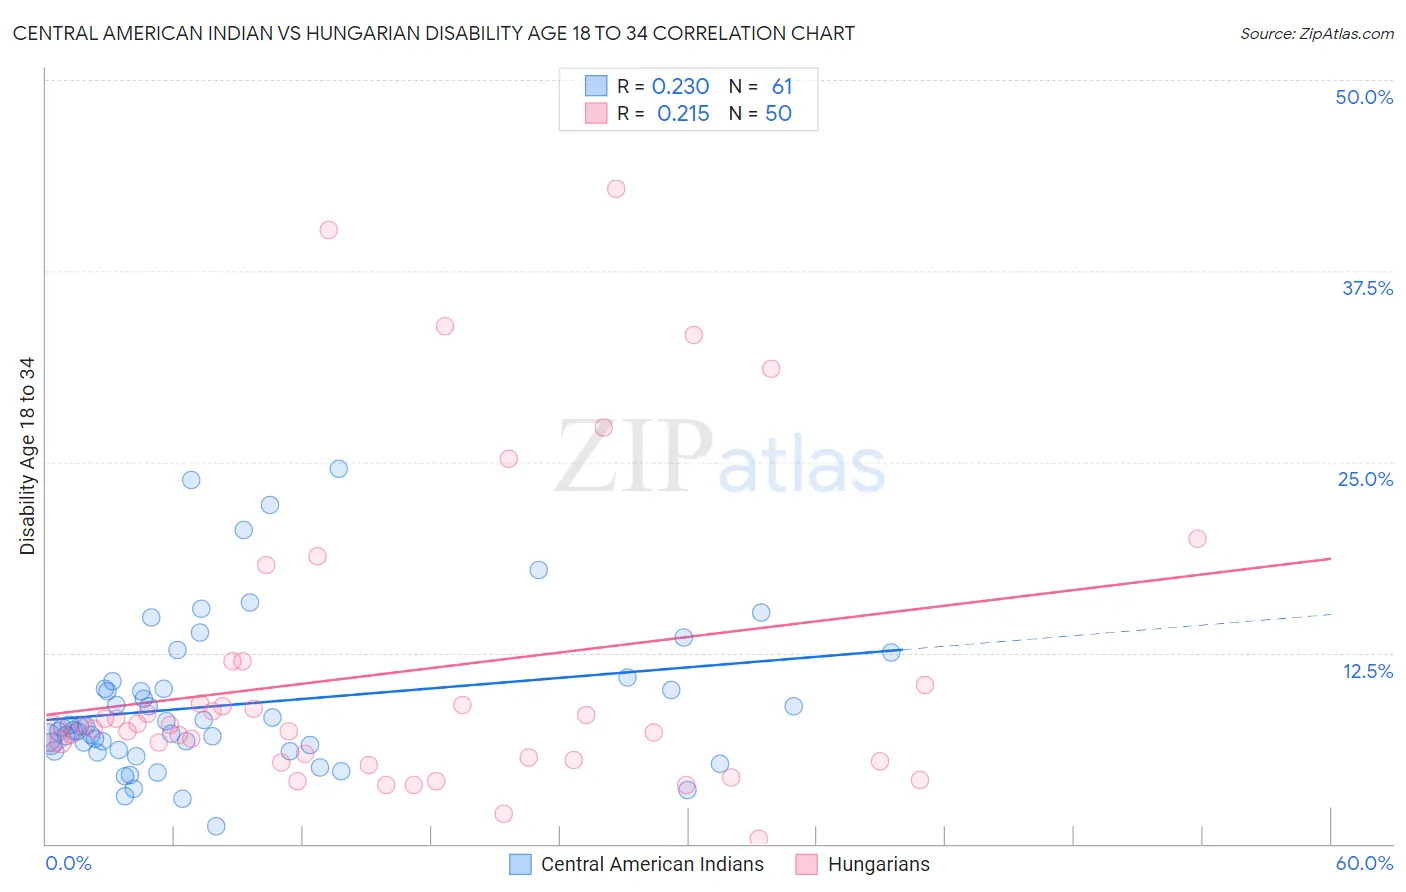
Central American Indian vs Hungarian Disability Age 18 to 34 Correlation Chart
The statistical analysis conducted on geographies consisting of 325,794,306 people shows a weak positive correlation between the proportion of Central American Indians and percentage of population with a disability between the ages 18 and 35 in the United States with a correlation coefficient (R) of 0.230 and weighted average of 6.9%. Similarly, the statistical analysis conducted on geographies consisting of 483,792,103 people shows a weak positive correlation between the proportion of Hungarians and percentage of population with a disability between the ages 18 and 35 in the United States with a correlation coefficient (R) of 0.215 and weighted average of 7.1%, a difference of 2.9%.
Disability Age 18 to 34 Correlation Summary
| Measurement | Central American Indian | Hungarian |
| Minimum | 1.1% | 0.32% |
| Maximum | 24.6% | 42.9% |
| Range | 23.4% | 42.5% |
| Mean | 9.1% | 11.2% |
| Median | 7.6% | 7.6% |
| Interquartile 25% (IQ1) | 6.1% | 5.5% |
| Interquartile 75% (IQ3) | 10.4% | 10.4% |
| Interquartile Range (IQR) | 4.3% | 4.9% |
| Standard Deviation (Sample) | 5.0% | 10.0% |
| Standard Deviation (Population) | 5.0% | 9.9% |
Demographics Similar to Central American Indians and Hungarians by Disability Age 18 to 34
In terms of disability age 18 to 34, the demographic groups most similar to Central American Indians are Ugandan (6.9%, a difference of 0.11%), Immigrants from Canada (7.0%, a difference of 0.15%), Immigrants from Yemen (7.0%, a difference of 0.21%), Lithuanian (7.0%, a difference of 0.24%), and Immigrants from North America (7.0%, a difference of 0.33%). Similarly, the demographic groups most similar to Hungarians are Immigrants from Zaire (7.1%, a difference of 0.10%), Icelander (7.1%, a difference of 0.31%), Immigrants from Congo (7.1%, a difference of 0.37%), Nepalese (7.1%, a difference of 0.41%), and Arapaho (7.1%, a difference of 0.42%).
| Demographics | Rating | Rank | Disability Age 18 to 34 |
| Central American Indians | 4.7 /100 | #225 | Tragic 6.9% |
| Ugandans | 4.4 /100 | #226 | Tragic 6.9% |
| Immigrants | Canada | 4.3 /100 | #227 | Tragic 7.0% |
| Immigrants | Yemen | 4.2 /100 | #228 | Tragic 7.0% |
| Lithuanians | 4.1 /100 | #229 | Tragic 7.0% |
| Immigrants | North America | 3.9 /100 | #230 | Tragic 7.0% |
| Ute | 3.8 /100 | #231 | Tragic 7.0% |
| Samoans | 3.2 /100 | #232 | Tragic 7.0% |
| New Zealanders | 2.7 /100 | #233 | Tragic 7.0% |
| Alsatians | 2.1 /100 | #234 | Tragic 7.0% |
| Sub-Saharan Africans | 1.7 /100 | #235 | Tragic 7.1% |
| Liberians | 1.5 /100 | #236 | Tragic 7.1% |
| Austrians | 1.3 /100 | #237 | Tragic 7.1% |
| Marshallese | 1.3 /100 | #238 | Tragic 7.1% |
| Italians | 1.2 /100 | #239 | Tragic 7.1% |
| Arapaho | 1.1 /100 | #240 | Tragic 7.1% |
| Nepalese | 1.1 /100 | #241 | Tragic 7.1% |
| Immigrants | Congo | 1.1 /100 | #242 | Tragic 7.1% |
| Icelanders | 1.0 /100 | #243 | Tragic 7.1% |
| Immigrants | Zaire | 0.9 /100 | #244 | Tragic 7.1% |
| Hungarians | 0.9 /100 | #245 | Tragic 7.1% |