Immigrants from Burma/Myanmar vs Hungarian In Labor Force | Age 45-54
COMPARE
Immigrants from Burma/Myanmar
Hungarian
In Labor Force | Age 45-54
In Labor Force | Age 45-54 Comparison
Immigrants from Burma/Myanmar
Hungarians
82.0%
IN LABOR FORCE | AGE 45-54
1.9/ 100
METRIC RATING
229th/ 347
METRIC RANK
82.7%
IN LABOR FORCE | AGE 45-54
38.0/ 100
METRIC RATING
180th/ 347
METRIC RANK
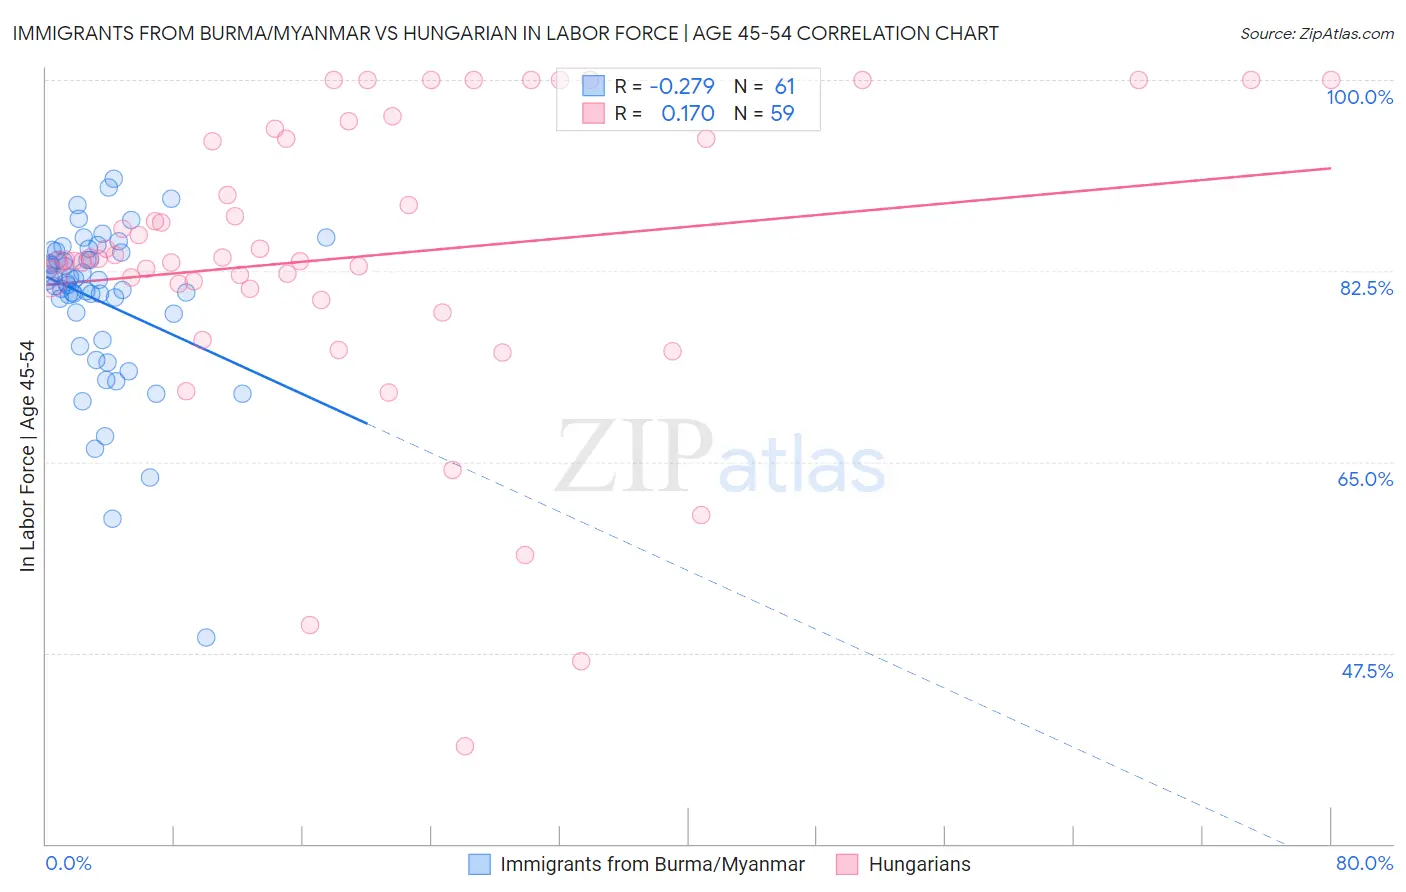
Immigrants from Burma/Myanmar vs Hungarian In Labor Force | Age 45-54 Correlation Chart
The statistical analysis conducted on geographies consisting of 172,276,017 people shows a weak negative correlation between the proportion of Immigrants from Burma/Myanmar and labor force participation rate among population between the ages 45 and 54 in the United States with a correlation coefficient (R) of -0.279 and weighted average of 82.0%. Similarly, the statistical analysis conducted on geographies consisting of 485,857,065 people shows a poor positive correlation between the proportion of Hungarians and labor force participation rate among population between the ages 45 and 54 in the United States with a correlation coefficient (R) of 0.170 and weighted average of 82.7%, a difference of 0.77%.
In Labor Force | Age 45-54 Correlation Summary
| Measurement | Immigrants from Burma/Myanmar | Hungarian |
| Minimum | 48.9% | 38.9% |
| Maximum | 90.9% | 100.0% |
| Range | 42.0% | 61.1% |
| Mean | 79.7% | 83.8% |
| Median | 81.5% | 83.6% |
| Interquartile 25% (IQ1) | 77.4% | 80.9% |
| Interquartile 75% (IQ3) | 84.3% | 94.6% |
| Interquartile Range (IQR) | 6.9% | 13.7% |
| Standard Deviation (Sample) | 7.5% | 13.6% |
| Standard Deviation (Population) | 7.4% | 13.5% |
Similar Demographics by In Labor Force | Age 45-54
Demographics Similar to Immigrants from Burma/Myanmar by In Labor Force | Age 45-54
In terms of in labor force | age 45-54, the demographic groups most similar to Immigrants from Burma/Myanmar are Jamaican (82.0%, a difference of 0.010%), Cape Verdean (82.1%, a difference of 0.020%), Immigrants from Senegal (82.0%, a difference of 0.030%), Immigrants from Portugal (82.0%, a difference of 0.030%), and Malaysian (82.0%, a difference of 0.030%).
| Demographics | Rating | Rank | In Labor Force | Age 45-54 |
| Immigrants | Ecuador | 3.4 /100 | #222 | Tragic 82.2% |
| Immigrants | Immigrants | 3.1 /100 | #223 | Tragic 82.1% |
| Immigrants | Jamaica | 2.7 /100 | #224 | Tragic 82.1% |
| Immigrants | Oceania | 2.5 /100 | #225 | Tragic 82.1% |
| Immigrants | Caribbean | 2.5 /100 | #226 | Tragic 82.1% |
| Immigrants | Germany | 2.4 /100 | #227 | Tragic 82.1% |
| Cape Verdeans | 2.1 /100 | #228 | Tragic 82.1% |
| Immigrants | Burma/Myanmar | 1.9 /100 | #229 | Tragic 82.0% |
| Jamaicans | 1.8 /100 | #230 | Tragic 82.0% |
| Immigrants | Senegal | 1.7 /100 | #231 | Tragic 82.0% |
| Immigrants | Portugal | 1.7 /100 | #232 | Tragic 82.0% |
| Malaysians | 1.7 /100 | #233 | Tragic 82.0% |
| Salvadorans | 1.7 /100 | #234 | Tragic 82.0% |
| Sub-Saharan Africans | 1.2 /100 | #235 | Tragic 82.0% |
| Basques | 1.2 /100 | #236 | Tragic 82.0% |
Demographics Similar to Hungarians by In Labor Force | Age 45-54
In terms of in labor force | age 45-54, the demographic groups most similar to Hungarians are Israeli (82.7%, a difference of 0.0%), Immigrants from Switzerland (82.7%, a difference of 0.010%), Immigrants from Hungary (82.7%, a difference of 0.010%), Nigerian (82.7%, a difference of 0.020%), and New Zealander (82.6%, a difference of 0.050%).
| Demographics | Rating | Rank | In Labor Force | Age 45-54 |
| Nicaraguans | 50.3 /100 | #173 | Average 82.8% |
| Costa Ricans | 50.0 /100 | #174 | Average 82.8% |
| Immigrants | Liberia | 47.9 /100 | #175 | Average 82.7% |
| Northern Europeans | 46.9 /100 | #176 | Average 82.7% |
| Immigrants | Nicaragua | 44.6 /100 | #177 | Average 82.7% |
| Nigerians | 40.5 /100 | #178 | Average 82.7% |
| Immigrants | Switzerland | 39.4 /100 | #179 | Fair 82.7% |
| Hungarians | 38.0 /100 | #180 | Fair 82.7% |
| Israelis | 37.7 /100 | #181 | Fair 82.7% |
| Immigrants | Hungary | 37.1 /100 | #182 | Fair 82.7% |
| New Zealanders | 32.7 /100 | #183 | Fair 82.6% |
| Europeans | 32.6 /100 | #184 | Fair 82.6% |
| Immigrants | England | 32.2 /100 | #185 | Fair 82.6% |
| Irish | 29.2 /100 | #186 | Fair 82.6% |
| Immigrants | Costa Rica | 28.3 /100 | #187 | Fair 82.6% |