Indonesian vs British Disability Age 18 to 34
COMPARE
Indonesian
British
Disability Age 18 to 34
Disability Age 18 to 34 Comparison
Indonesians
British
7.2%
DISABILITY AGE 18 TO 34
0.4/ 100
METRIC RATING
254th/ 347
METRIC RANK
7.3%
DISABILITY AGE 18 TO 34
0.2/ 100
METRIC RATING
263rd/ 347
METRIC RANK
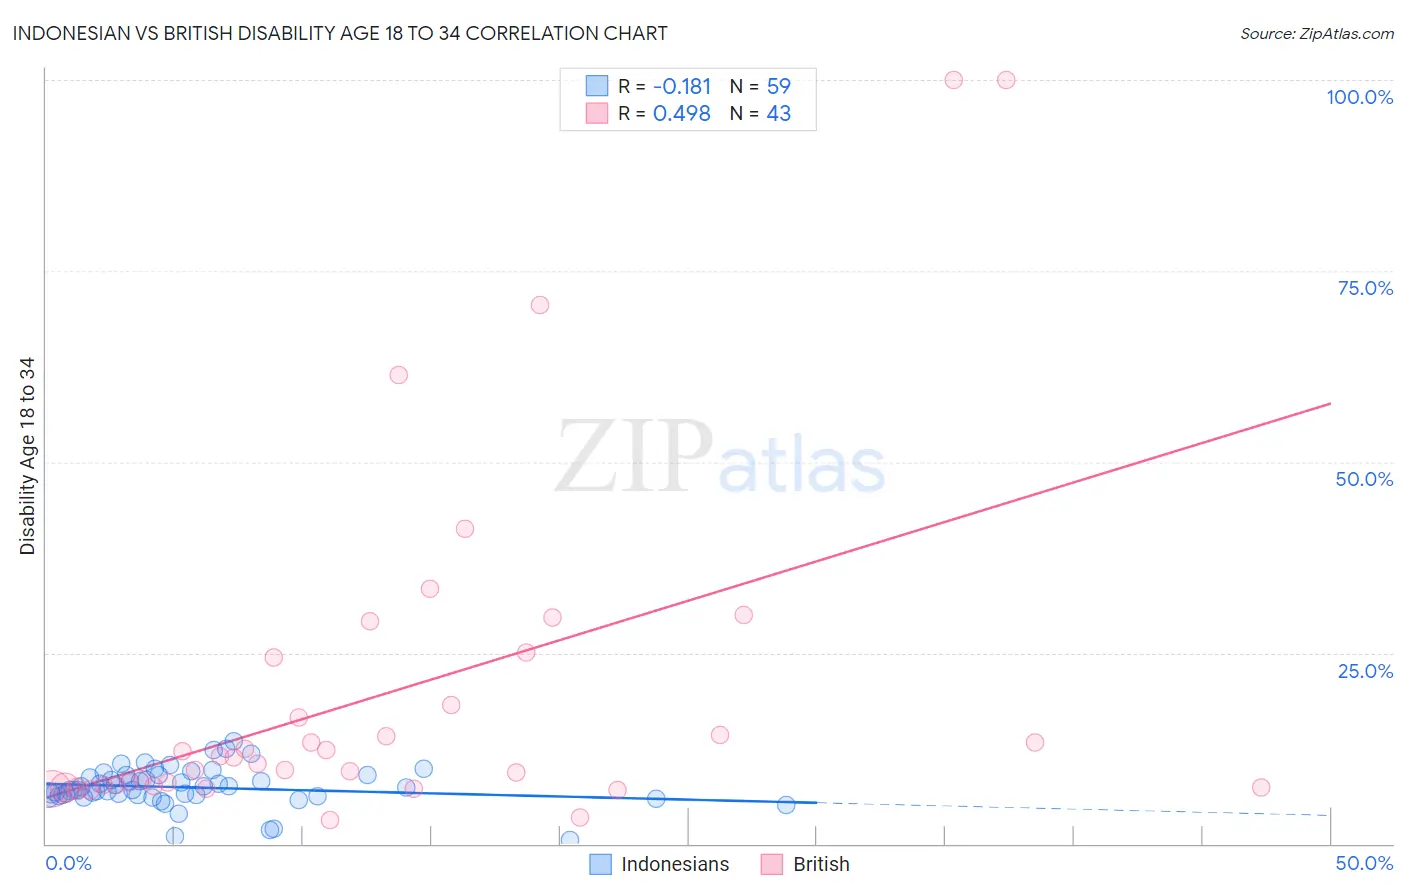
Indonesian vs British Disability Age 18 to 34 Correlation Chart
The statistical analysis conducted on geographies consisting of 162,691,406 people shows a poor negative correlation between the proportion of Indonesians and percentage of population with a disability between the ages 18 and 35 in the United States with a correlation coefficient (R) of -0.181 and weighted average of 7.2%. Similarly, the statistical analysis conducted on geographies consisting of 528,221,956 people shows a moderate positive correlation between the proportion of British and percentage of population with a disability between the ages 18 and 35 in the United States with a correlation coefficient (R) of 0.498 and weighted average of 7.3%, a difference of 1.4%.
Disability Age 18 to 34 Correlation Summary
| Measurement | Indonesian | British |
| Minimum | 0.44% | 3.0% |
| Maximum | 13.4% | 100.0% |
| Range | 13.0% | 97.0% |
| Mean | 7.4% | 19.9% |
| Median | 7.0% | 11.2% |
| Interquartile 25% (IQ1) | 6.3% | 7.5% |
| Interquartile 75% (IQ3) | 9.0% | 24.4% |
| Interquartile Range (IQR) | 2.6% | 16.9% |
| Standard Deviation (Sample) | 2.5% | 22.8% |
| Standard Deviation (Population) | 2.5% | 22.5% |
Demographics Similar to Indonesians and British by Disability Age 18 to 34
In terms of disability age 18 to 34, the demographic groups most similar to Indonesians are Immigrants from Germany (7.2%, a difference of 0.020%), Immigrants from Laos (7.2%, a difference of 0.050%), Croatian (7.2%, a difference of 0.29%), Czech (7.2%, a difference of 0.32%), and Polish (7.2%, a difference of 0.55%). Similarly, the demographic groups most similar to British are Bermudan (7.3%, a difference of 0.25%), Slovene (7.3%, a difference of 0.28%), Canadian (7.3%, a difference of 0.29%), Northern European (7.3%, a difference of 0.32%), and German Russian (7.4%, a difference of 0.44%).
| Demographics | Rating | Rank | Disability Age 18 to 34 |
| Guamanians/Chamorros | 0.8 /100 | #248 | Tragic 7.2% |
| Malaysians | 0.7 /100 | #249 | Tragic 7.2% |
| Fijians | 0.6 /100 | #250 | Tragic 7.2% |
| Spaniards | 0.6 /100 | #251 | Tragic 7.2% |
| Poles | 0.6 /100 | #252 | Tragic 7.2% |
| Croatians | 0.5 /100 | #253 | Tragic 7.2% |
| Indonesians | 0.4 /100 | #254 | Tragic 7.2% |
| Immigrants | Germany | 0.4 /100 | #255 | Tragic 7.2% |
| Immigrants | Laos | 0.4 /100 | #256 | Tragic 7.2% |
| Czechs | 0.3 /100 | #257 | Tragic 7.2% |
| Immigrants | Micronesia | 0.3 /100 | #258 | Tragic 7.3% |
| Somalis | 0.2 /100 | #259 | Tragic 7.3% |
| Tohono O'odham | 0.2 /100 | #260 | Tragic 7.3% |
| Northern Europeans | 0.2 /100 | #261 | Tragic 7.3% |
| Canadians | 0.2 /100 | #262 | Tragic 7.3% |
| British | 0.2 /100 | #263 | Tragic 7.3% |
| Bermudans | 0.1 /100 | #264 | Tragic 7.3% |
| Slovenes | 0.1 /100 | #265 | Tragic 7.3% |
| German Russians | 0.1 /100 | #266 | Tragic 7.4% |
| Bangladeshis | 0.1 /100 | #267 | Tragic 7.4% |
| Portuguese | 0.1 /100 | #268 | Tragic 7.4% |