Immigrants from Bulgaria vs U.S. Virgin Islander In Labor Force | Age 45-54
COMPARE
Immigrants from Bulgaria
U.S. Virgin Islander
In Labor Force | Age 45-54
In Labor Force | Age 45-54 Comparison
Immigrants from Bulgaria
U.S. Virgin Islanders
83.8%
IN LABOR FORCE | AGE 45-54
99.7/ 100
METRIC RATING
30th/ 347
METRIC RANK
81.2%
IN LABOR FORCE | AGE 45-54
0.0/ 100
METRIC RATING
276th/ 347
METRIC RANK
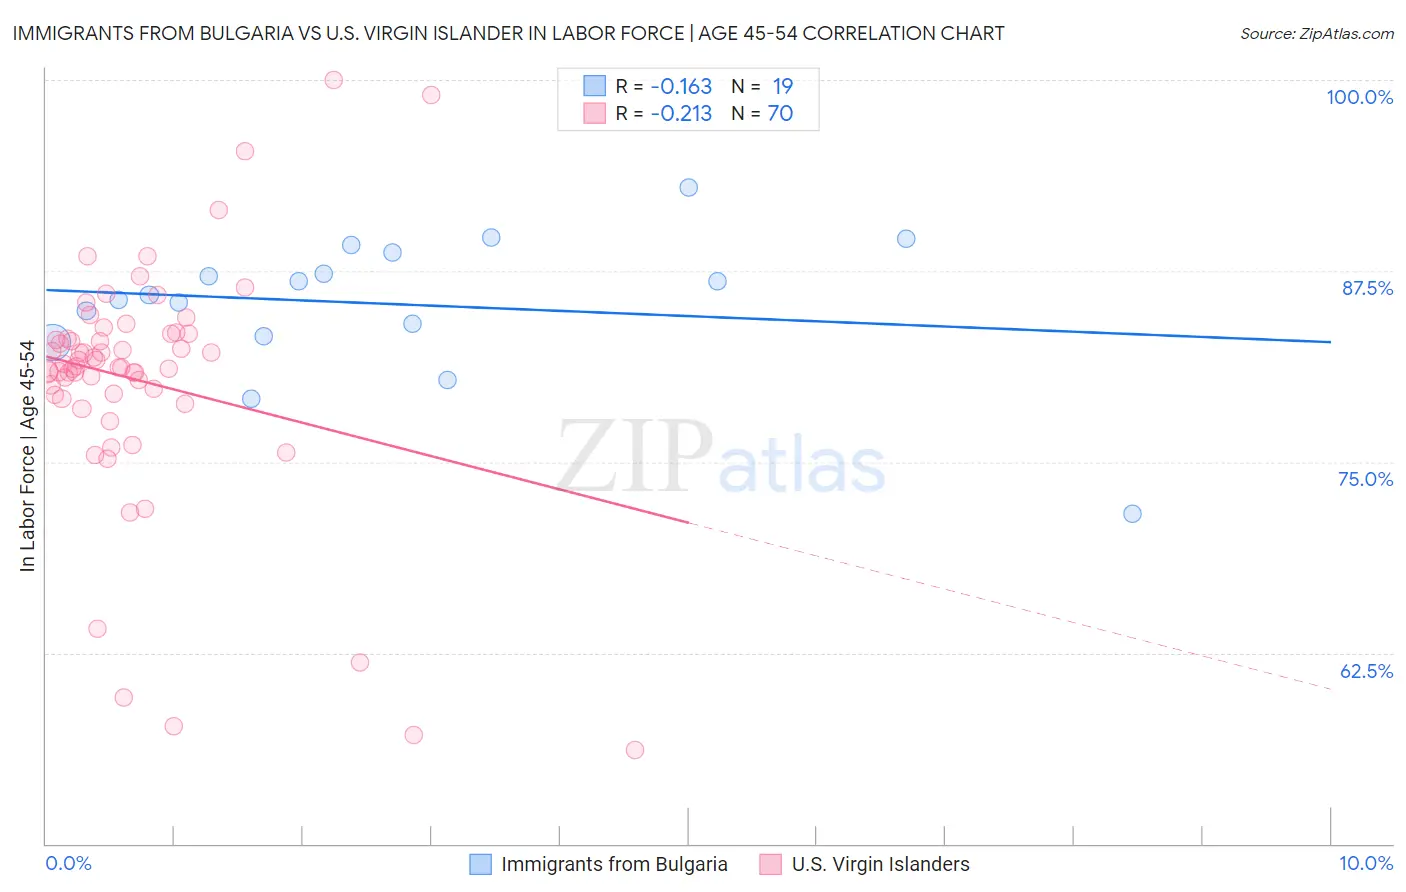
Immigrants from Bulgaria vs U.S. Virgin Islander In Labor Force | Age 45-54 Correlation Chart
The statistical analysis conducted on geographies consisting of 172,534,936 people shows a poor negative correlation between the proportion of Immigrants from Bulgaria and labor force participation rate among population between the ages 45 and 54 in the United States with a correlation coefficient (R) of -0.163 and weighted average of 83.8%. Similarly, the statistical analysis conducted on geographies consisting of 87,510,116 people shows a weak negative correlation between the proportion of U.S. Virgin Islanders and labor force participation rate among population between the ages 45 and 54 in the United States with a correlation coefficient (R) of -0.213 and weighted average of 81.2%, a difference of 3.2%.
In Labor Force | Age 45-54 Correlation Summary
| Measurement | Immigrants from Bulgaria | U.S. Virgin Islander |
| Minimum | 71.6% | 56.1% |
| Maximum | 92.9% | 100.0% |
| Range | 21.3% | 43.9% |
| Mean | 85.3% | 80.3% |
| Median | 85.9% | 81.2% |
| Interquartile 25% (IQ1) | 83.2% | 79.4% |
| Interquartile 75% (IQ3) | 88.7% | 83.4% |
| Interquartile Range (IQR) | 5.5% | 4.0% |
| Standard Deviation (Sample) | 4.7% | 8.1% |
| Standard Deviation (Population) | 4.6% | 8.0% |
Similar Demographics by In Labor Force | Age 45-54
Demographics Similar to Immigrants from Bulgaria by In Labor Force | Age 45-54
In terms of in labor force | age 45-54, the demographic groups most similar to Immigrants from Bulgaria are Immigrants from Eritrea (83.8%, a difference of 0.020%), Immigrants from Pakistan (83.8%, a difference of 0.030%), Immigrants from Lithuania (83.9%, a difference of 0.040%), Turkish (83.8%, a difference of 0.040%), and Latvian (83.8%, a difference of 0.040%).
| Demographics | Rating | Rank | In Labor Force | Age 45-54 |
| Tlingit-Haida | 99.8 /100 | #23 | Exceptional 83.9% |
| Slovenes | 99.8 /100 | #24 | Exceptional 83.9% |
| Immigrants | North Macedonia | 99.8 /100 | #25 | Exceptional 83.9% |
| Immigrants | Serbia | 99.8 /100 | #26 | Exceptional 83.9% |
| Immigrants | Brazil | 99.8 /100 | #27 | Exceptional 83.9% |
| Immigrants | Lithuania | 99.8 /100 | #28 | Exceptional 83.9% |
| Immigrants | Pakistan | 99.7 /100 | #29 | Exceptional 83.8% |
| Immigrants | Bulgaria | 99.7 /100 | #30 | Exceptional 83.8% |
| Immigrants | Eritrea | 99.7 /100 | #31 | Exceptional 83.8% |
| Turks | 99.7 /100 | #32 | Exceptional 83.8% |
| Latvians | 99.7 /100 | #33 | Exceptional 83.8% |
| Kenyans | 99.5 /100 | #34 | Exceptional 83.7% |
| Brazilians | 99.5 /100 | #35 | Exceptional 83.7% |
| Ugandans | 99.5 /100 | #36 | Exceptional 83.7% |
| Swedes | 99.4 /100 | #37 | Exceptional 83.7% |
Demographics Similar to U.S. Virgin Islanders by In Labor Force | Age 45-54
In terms of in labor force | age 45-54, the demographic groups most similar to U.S. Virgin Islanders are Guatemalan (81.2%, a difference of 0.020%), Nonimmigrants (81.2%, a difference of 0.040%), British West Indian (81.2%, a difference of 0.050%), Chippewa (81.3%, a difference of 0.090%), and Immigrants from Guatemala (81.1%, a difference of 0.10%).
| Demographics | Rating | Rank | In Labor Force | Age 45-54 |
| Alsatians | 0.0 /100 | #269 | Tragic 81.3% |
| Bangladeshis | 0.0 /100 | #270 | Tragic 81.3% |
| Immigrants | Barbados | 0.0 /100 | #271 | Tragic 81.3% |
| Spanish | 0.0 /100 | #272 | Tragic 81.3% |
| Chippewa | 0.0 /100 | #273 | Tragic 81.3% |
| British West Indians | 0.0 /100 | #274 | Tragic 81.2% |
| Immigrants | Nonimmigrants | 0.0 /100 | #275 | Tragic 81.2% |
| U.S. Virgin Islanders | 0.0 /100 | #276 | Tragic 81.2% |
| Guatemalans | 0.0 /100 | #277 | Tragic 81.2% |
| Immigrants | Guatemala | 0.0 /100 | #278 | Tragic 81.1% |
| Immigrants | Micronesia | 0.0 /100 | #279 | Tragic 81.1% |
| Immigrants | Latin America | 0.0 /100 | #280 | Tragic 81.0% |
| Immigrants | Grenada | 0.0 /100 | #281 | Tragic 81.0% |
| Aleuts | 0.0 /100 | #282 | Tragic 81.0% |
| French American Indians | 0.0 /100 | #283 | Tragic 80.8% |