Immigrants from Bulgaria vs Senegalese 5th Grade
COMPARE
Immigrants from Bulgaria
Senegalese
5th Grade
5th Grade Comparison
Immigrants from Bulgaria
Senegalese
97.6%
5TH GRADE
93.1/ 100
METRIC RATING
125th/ 347
METRIC RANK
97.0%
5TH GRADE
2.8/ 100
METRIC RATING
236th/ 347
METRIC RANK
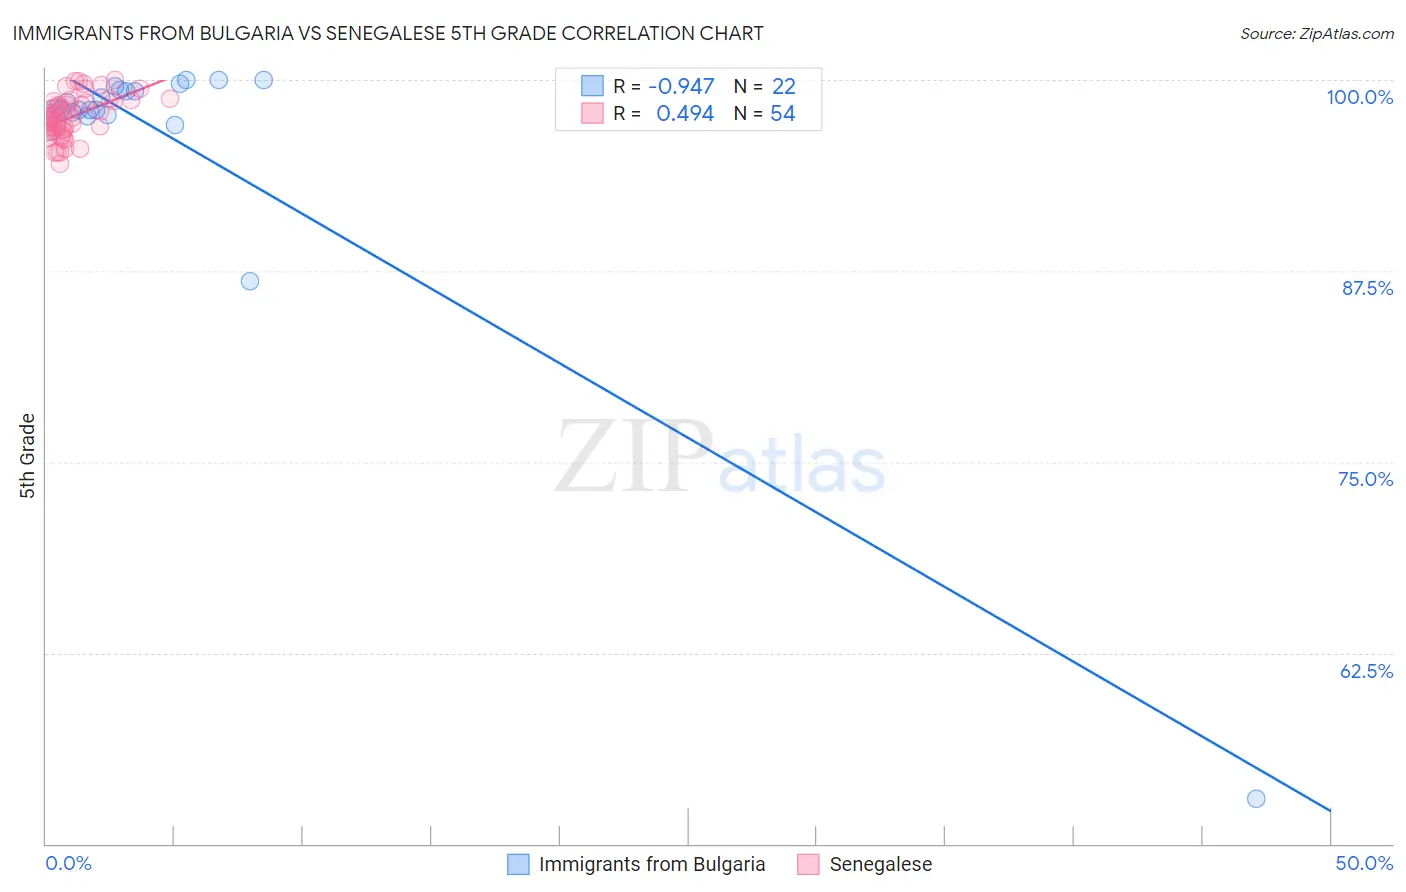
Immigrants from Bulgaria vs Senegalese 5th Grade Correlation Chart
The statistical analysis conducted on geographies consisting of 172,552,181 people shows a near-perfect negative correlation between the proportion of Immigrants from Bulgaria and percentage of population with at least 5th grade education in the United States with a correlation coefficient (R) of -0.947 and weighted average of 97.6%. Similarly, the statistical analysis conducted on geographies consisting of 78,142,569 people shows a moderate positive correlation between the proportion of Senegalese and percentage of population with at least 5th grade education in the United States with a correlation coefficient (R) of 0.494 and weighted average of 97.0%, a difference of 0.64%.
5th Grade Correlation Summary
| Measurement | Immigrants from Bulgaria | Senegalese |
| Minimum | 52.9% | 94.5% |
| Maximum | 100.0% | 100.0% |
| Range | 47.1% | 5.5% |
| Mean | 96.0% | 97.6% |
| Median | 98.1% | 97.5% |
| Interquartile 25% (IQ1) | 97.7% | 96.7% |
| Interquartile 75% (IQ3) | 99.4% | 98.6% |
| Interquartile Range (IQR) | 1.7% | 1.9% |
| Standard Deviation (Sample) | 10.0% | 1.4% |
| Standard Deviation (Population) | 9.8% | 1.4% |
Similar Demographics by 5th Grade
Demographics Similar to Immigrants from Bulgaria by 5th Grade
In terms of 5th grade, the demographic groups most similar to Immigrants from Bulgaria are Spanish (97.6%, a difference of 0.010%), Hmong (97.6%, a difference of 0.010%), Immigrants from Serbia (97.6%, a difference of 0.010%), Colville (97.6%, a difference of 0.020%), and Immigrants from Europe (97.6%, a difference of 0.020%).
| Demographics | Rating | Rank | 5th Grade |
| Basques | 95.2 /100 | #118 | Exceptional 97.6% |
| Syrians | 95.1 /100 | #119 | Exceptional 97.6% |
| Immigrants | Zimbabwe | 94.9 /100 | #120 | Exceptional 97.6% |
| Immigrants | France | 94.8 /100 | #121 | Exceptional 97.6% |
| Immigrants | Japan | 94.7 /100 | #122 | Exceptional 97.6% |
| Immigrants | Norway | 94.6 /100 | #123 | Exceptional 97.6% |
| Spanish | 93.7 /100 | #124 | Exceptional 97.6% |
| Immigrants | Bulgaria | 93.1 /100 | #125 | Exceptional 97.6% |
| Hmong | 92.3 /100 | #126 | Exceptional 97.6% |
| Immigrants | Serbia | 92.3 /100 | #127 | Exceptional 97.6% |
| Colville | 92.0 /100 | #128 | Exceptional 97.6% |
| Immigrants | Europe | 91.9 /100 | #129 | Exceptional 97.6% |
| Immigrants | Romania | 91.6 /100 | #130 | Exceptional 97.6% |
| Pima | 91.2 /100 | #131 | Exceptional 97.6% |
| Immigrants | Kuwait | 90.4 /100 | #132 | Exceptional 97.6% |
Demographics Similar to Senegalese by 5th Grade
In terms of 5th grade, the demographic groups most similar to Senegalese are Subsaharan African (97.0%, a difference of 0.020%), Tohono O'odham (97.0%, a difference of 0.020%), Uruguayan (97.0%, a difference of 0.020%), Immigrants from Indonesia (96.9%, a difference of 0.030%), and Asian (96.9%, a difference of 0.030%).
| Demographics | Rating | Rank | 5th Grade |
| Yuman | 4.5 /100 | #229 | Tragic 97.0% |
| Immigrants | Western Asia | 4.3 /100 | #230 | Tragic 97.0% |
| Immigrants | Malaysia | 4.1 /100 | #231 | Tragic 97.0% |
| Immigrants | Eastern Asia | 4.0 /100 | #232 | Tragic 97.0% |
| Sub-Saharan Africans | 3.3 /100 | #233 | Tragic 97.0% |
| Tohono O'odham | 3.2 /100 | #234 | Tragic 97.0% |
| Uruguayans | 3.2 /100 | #235 | Tragic 97.0% |
| Senegalese | 2.8 /100 | #236 | Tragic 97.0% |
| Immigrants | Indonesia | 2.0 /100 | #237 | Tragic 96.9% |
| Asians | 2.0 /100 | #238 | Tragic 96.9% |
| Nigerians | 1.9 /100 | #239 | Tragic 96.9% |
| Indians (Asian) | 1.9 /100 | #240 | Tragic 96.9% |
| Immigrants | Asia | 1.7 /100 | #241 | Tragic 96.9% |
| Immigrants | Costa Rica | 1.6 /100 | #242 | Tragic 96.9% |
| Immigrants | Eastern Africa | 1.6 /100 | #243 | Tragic 96.9% |