Yakama vs Samoan Disability Age 35 to 64
COMPARE
Yakama
Samoan
Disability Age 35 to 64
Disability Age 35 to 64 Comparison
Yakama
Samoans
13.6%
DISABILITY AGE 35 TO 64
0.0/ 100
METRIC RATING
295th/ 347
METRIC RANK
12.1%
DISABILITY AGE 35 TO 64
2.8/ 100
METRIC RATING
242nd/ 347
METRIC RANK
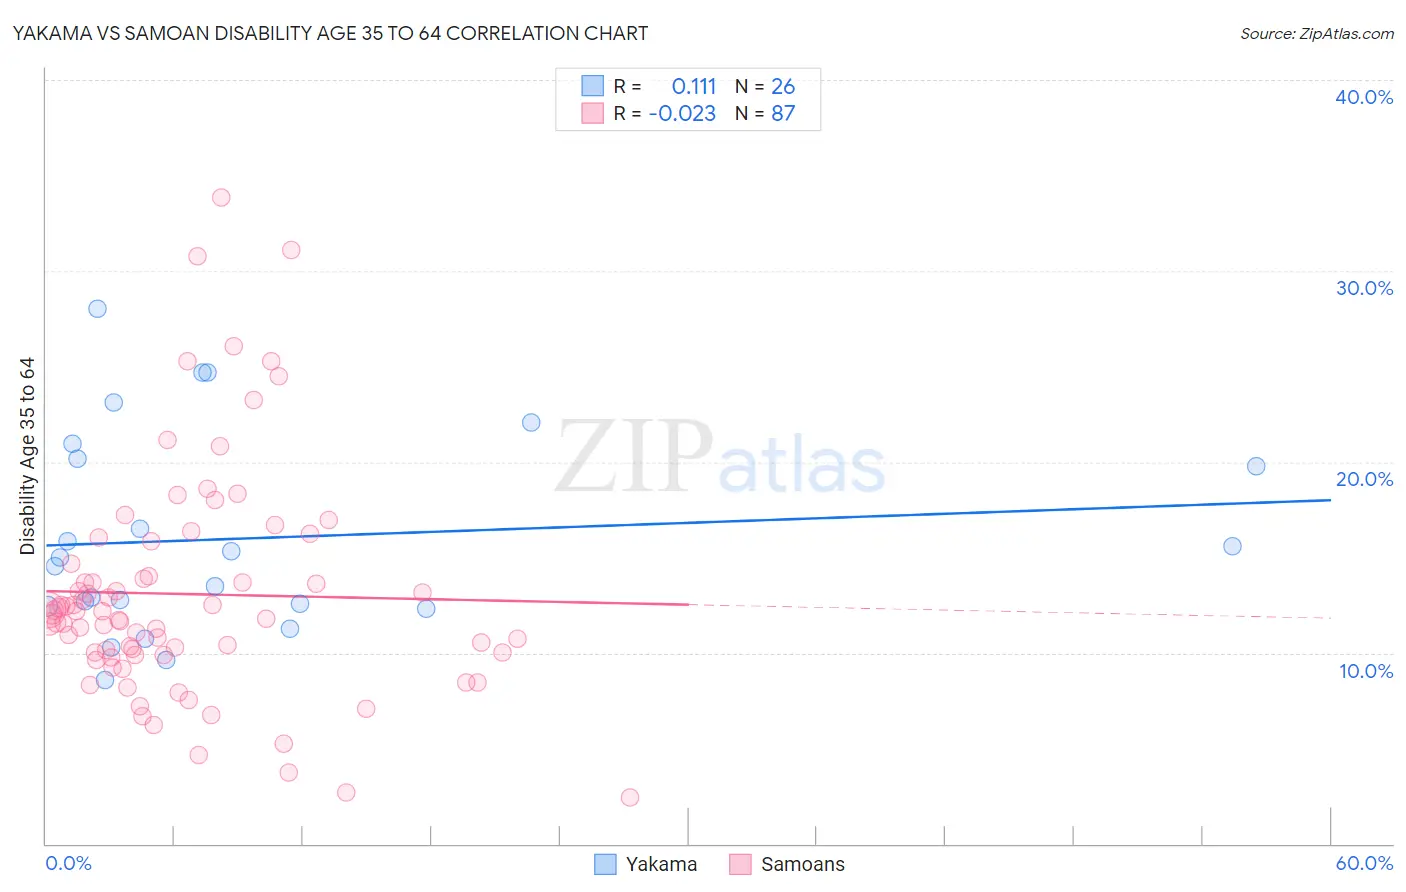
Yakama vs Samoan Disability Age 35 to 64 Correlation Chart
The statistical analysis conducted on geographies consisting of 19,917,759 people shows a poor positive correlation between the proportion of Yakama and percentage of population with a disability between the ages 34 and 64 in the United States with a correlation coefficient (R) of 0.111 and weighted average of 13.6%. Similarly, the statistical analysis conducted on geographies consisting of 225,063,493 people shows no correlation between the proportion of Samoans and percentage of population with a disability between the ages 34 and 64 in the United States with a correlation coefficient (R) of -0.023 and weighted average of 12.1%, a difference of 12.2%.
Disability Age 35 to 64 Correlation Summary
| Measurement | Yakama | Samoan |
| Minimum | 8.6% | 2.4% |
| Maximum | 28.0% | 33.9% |
| Range | 19.4% | 31.4% |
| Mean | 16.0% | 13.1% |
| Median | 14.8% | 12.0% |
| Interquartile 25% (IQ1) | 12.4% | 9.9% |
| Interquartile 75% (IQ3) | 20.1% | 14.6% |
| Interquartile Range (IQR) | 7.7% | 4.7% |
| Standard Deviation (Sample) | 5.3% | 6.0% |
| Standard Deviation (Population) | 5.2% | 5.9% |
Similar Demographics by Disability Age 35 to 64
Demographics Similar to Yakama by Disability Age 35 to 64
In terms of disability age 35 to 64, the demographic groups most similar to Yakama are African (13.6%, a difference of 0.22%), Bangladeshi (13.6%, a difference of 0.57%), Cheyenne (13.6%, a difference of 0.60%), Yaqui (13.5%, a difference of 0.68%), and Spanish American (13.7%, a difference of 0.80%).
| Demographics | Rating | Rank | Disability Age 35 to 64 |
| Fijians | 0.0 /100 | #288 | Tragic 13.2% |
| Indonesians | 0.0 /100 | #289 | Tragic 13.2% |
| Immigrants | Liberia | 0.0 /100 | #290 | Tragic 13.2% |
| Immigrants | Congo | 0.0 /100 | #291 | Tragic 13.3% |
| Puget Sound Salish | 0.0 /100 | #292 | Tragic 13.3% |
| Ute | 0.0 /100 | #293 | Tragic 13.4% |
| Yaqui | 0.0 /100 | #294 | Tragic 13.5% |
| Yakama | 0.0 /100 | #295 | Tragic 13.6% |
| Africans | 0.0 /100 | #296 | Tragic 13.6% |
| Bangladeshis | 0.0 /100 | #297 | Tragic 13.6% |
| Cheyenne | 0.0 /100 | #298 | Tragic 13.6% |
| Spanish Americans | 0.0 /100 | #299 | Tragic 13.7% |
| Delaware | 0.0 /100 | #300 | Tragic 13.7% |
| French American Indians | 0.0 /100 | #301 | Tragic 13.7% |
| Aleuts | 0.0 /100 | #302 | Tragic 13.8% |
Demographics Similar to Samoans by Disability Age 35 to 64
In terms of disability age 35 to 64, the demographic groups most similar to Samoans are Slovak (12.1%, a difference of 0.10%), Mexican American Indian (12.0%, a difference of 0.27%), Immigrants from Western Africa (12.0%, a difference of 0.30%), Immigrants from Thailand (12.0%, a difference of 0.30%), and Finnish (12.1%, a difference of 0.36%).
| Demographics | Rating | Rank | Disability Age 35 to 64 |
| Belizeans | 4.5 /100 | #235 | Tragic 12.0% |
| Immigrants | Middle Africa | 4.5 /100 | #236 | Tragic 12.0% |
| Immigrants | Cambodia | 3.9 /100 | #237 | Tragic 12.0% |
| West Indians | 3.7 /100 | #238 | Tragic 12.0% |
| Immigrants | Western Africa | 3.3 /100 | #239 | Tragic 12.0% |
| Immigrants | Thailand | 3.3 /100 | #240 | Tragic 12.0% |
| Mexican American Indians | 3.2 /100 | #241 | Tragic 12.0% |
| Samoans | 2.8 /100 | #242 | Tragic 12.1% |
| Slovaks | 2.7 /100 | #243 | Tragic 12.1% |
| Finns | 2.3 /100 | #244 | Tragic 12.1% |
| Immigrants | Mexico | 2.2 /100 | #245 | Tragic 12.1% |
| Guamanians/Chamorros | 1.4 /100 | #246 | Tragic 12.2% |
| Immigrants | Senegal | 1.3 /100 | #247 | Tragic 12.2% |
| Spaniards | 1.3 /100 | #248 | Tragic 12.3% |
| Hispanics or Latinos | 1.3 /100 | #249 | Tragic 12.3% |