Immigrants from Nicaragua vs Samoan Disability Age 35 to 64
COMPARE
Immigrants from Nicaragua
Samoan
Disability Age 35 to 64
Disability Age 35 to 64 Comparison
Immigrants from Nicaragua
Samoans
10.1%
DISABILITY AGE 35 TO 64
99.5/ 100
METRIC RATING
70th/ 347
METRIC RANK
12.1%
DISABILITY AGE 35 TO 64
2.8/ 100
METRIC RATING
242nd/ 347
METRIC RANK
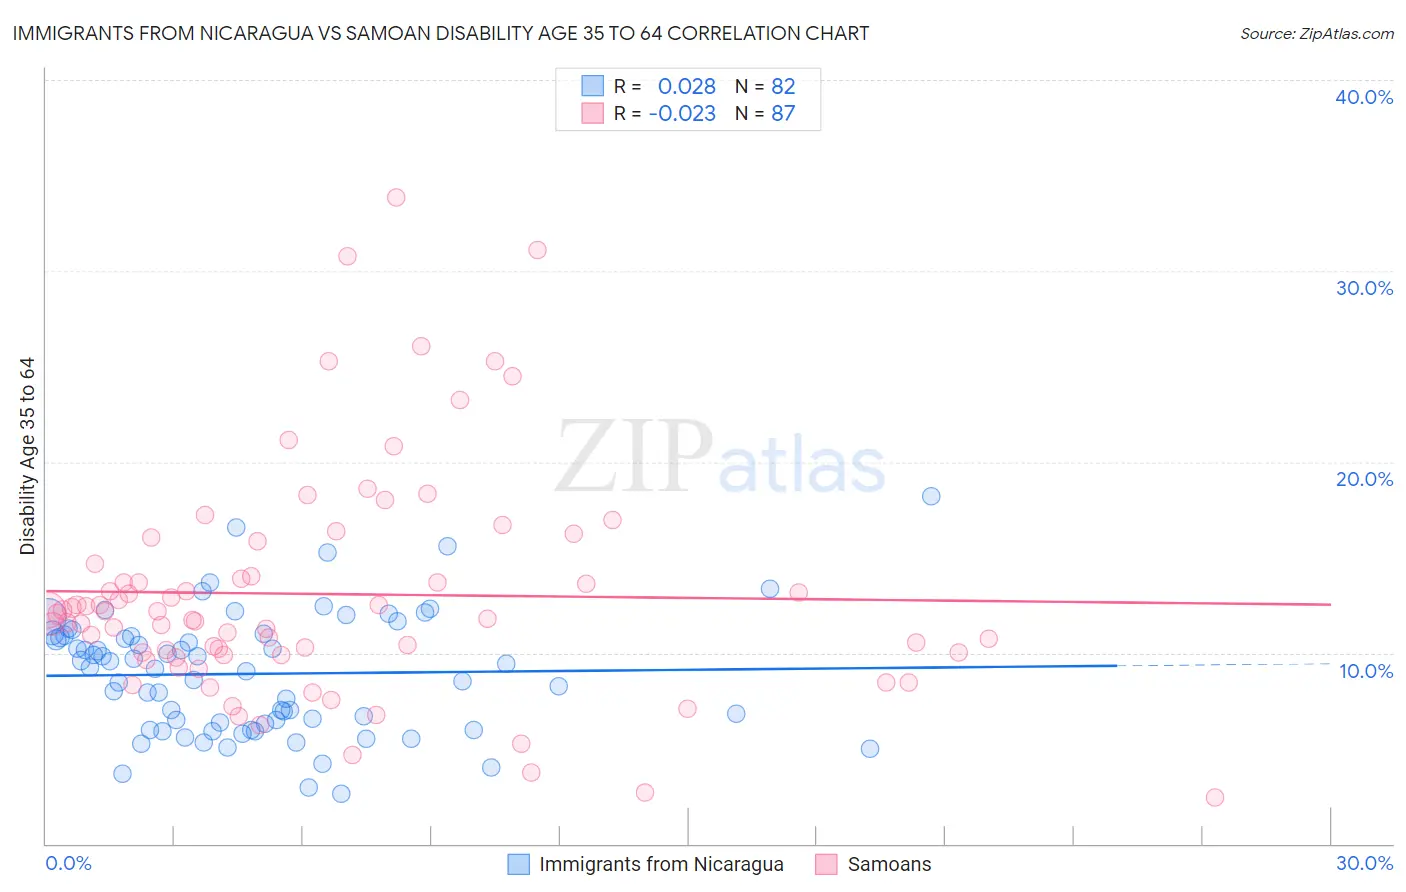
Immigrants from Nicaragua vs Samoan Disability Age 35 to 64 Correlation Chart
The statistical analysis conducted on geographies consisting of 236,317,781 people shows no correlation between the proportion of Immigrants from Nicaragua and percentage of population with a disability between the ages 34 and 64 in the United States with a correlation coefficient (R) of 0.028 and weighted average of 10.1%. Similarly, the statistical analysis conducted on geographies consisting of 225,063,493 people shows no correlation between the proportion of Samoans and percentage of population with a disability between the ages 34 and 64 in the United States with a correlation coefficient (R) of -0.023 and weighted average of 12.1%, a difference of 19.9%.
Disability Age 35 to 64 Correlation Summary
| Measurement | Immigrants from Nicaragua | Samoan |
| Minimum | 2.6% | 2.4% |
| Maximum | 18.2% | 33.9% |
| Range | 15.6% | 31.4% |
| Mean | 8.9% | 13.1% |
| Median | 9.2% | 12.0% |
| Interquartile 25% (IQ1) | 6.3% | 9.9% |
| Interquartile 75% (IQ3) | 10.9% | 14.6% |
| Interquartile Range (IQR) | 4.6% | 4.7% |
| Standard Deviation (Sample) | 3.2% | 6.0% |
| Standard Deviation (Population) | 3.2% | 5.9% |
Similar Demographics by Disability Age 35 to 64
Demographics Similar to Immigrants from Nicaragua by Disability Age 35 to 64
In terms of disability age 35 to 64, the demographic groups most similar to Immigrants from Nicaragua are Immigrants from Kazakhstan (10.1%, a difference of 0.010%), Immigrants from Eastern Europe (10.1%, a difference of 0.020%), Immigrants from Switzerland (10.1%, a difference of 0.030%), Immigrants from Uzbekistan (10.1%, a difference of 0.14%), and Immigrants from Northern Europe (10.1%, a difference of 0.21%).
| Demographics | Rating | Rank | Disability Age 35 to 64 |
| Immigrants | Czechoslovakia | 99.7 /100 | #63 | Exceptional 10.0% |
| Immigrants | Romania | 99.7 /100 | #64 | Exceptional 10.0% |
| Immigrants | Poland | 99.6 /100 | #65 | Exceptional 10.0% |
| Cubans | 99.6 /100 | #66 | Exceptional 10.0% |
| Immigrants | Uzbekistan | 99.5 /100 | #67 | Exceptional 10.1% |
| Immigrants | Switzerland | 99.5 /100 | #68 | Exceptional 10.1% |
| Immigrants | Eastern Europe | 99.5 /100 | #69 | Exceptional 10.1% |
| Immigrants | Nicaragua | 99.5 /100 | #70 | Exceptional 10.1% |
| Immigrants | Kazakhstan | 99.5 /100 | #71 | Exceptional 10.1% |
| Immigrants | Northern Europe | 99.5 /100 | #72 | Exceptional 10.1% |
| Immigrants | France | 99.5 /100 | #73 | Exceptional 10.1% |
| Laotians | 99.4 /100 | #74 | Exceptional 10.1% |
| Immigrants | Latvia | 99.4 /100 | #75 | Exceptional 10.1% |
| Immigrants | Chile | 99.4 /100 | #76 | Exceptional 10.1% |
| Mongolians | 99.4 /100 | #77 | Exceptional 10.1% |
Demographics Similar to Samoans by Disability Age 35 to 64
In terms of disability age 35 to 64, the demographic groups most similar to Samoans are Slovak (12.1%, a difference of 0.10%), Mexican American Indian (12.0%, a difference of 0.27%), Immigrants from Western Africa (12.0%, a difference of 0.30%), Immigrants from Thailand (12.0%, a difference of 0.30%), and Finnish (12.1%, a difference of 0.36%).
| Demographics | Rating | Rank | Disability Age 35 to 64 |
| Belizeans | 4.5 /100 | #235 | Tragic 12.0% |
| Immigrants | Middle Africa | 4.5 /100 | #236 | Tragic 12.0% |
| Immigrants | Cambodia | 3.9 /100 | #237 | Tragic 12.0% |
| West Indians | 3.7 /100 | #238 | Tragic 12.0% |
| Immigrants | Western Africa | 3.3 /100 | #239 | Tragic 12.0% |
| Immigrants | Thailand | 3.3 /100 | #240 | Tragic 12.0% |
| Mexican American Indians | 3.2 /100 | #241 | Tragic 12.0% |
| Samoans | 2.8 /100 | #242 | Tragic 12.1% |
| Slovaks | 2.7 /100 | #243 | Tragic 12.1% |
| Finns | 2.3 /100 | #244 | Tragic 12.1% |
| Immigrants | Mexico | 2.2 /100 | #245 | Tragic 12.1% |
| Guamanians/Chamorros | 1.4 /100 | #246 | Tragic 12.2% |
| Immigrants | Senegal | 1.3 /100 | #247 | Tragic 12.2% |
| Spaniards | 1.3 /100 | #248 | Tragic 12.3% |
| Hispanics or Latinos | 1.3 /100 | #249 | Tragic 12.3% |