Immigrants from Bulgaria vs Burmese Disability Age 35 to 64
COMPARE
Immigrants from Bulgaria
Burmese
Disability Age 35 to 64
Disability Age 35 to 64 Comparison
Immigrants from Bulgaria
Burmese
9.8%
DISABILITY AGE 35 TO 64
99.8/ 100
METRIC RATING
52nd/ 347
METRIC RANK
9.2%
DISABILITY AGE 35 TO 64
100.0/ 100
METRIC RATING
17th/ 347
METRIC RANK
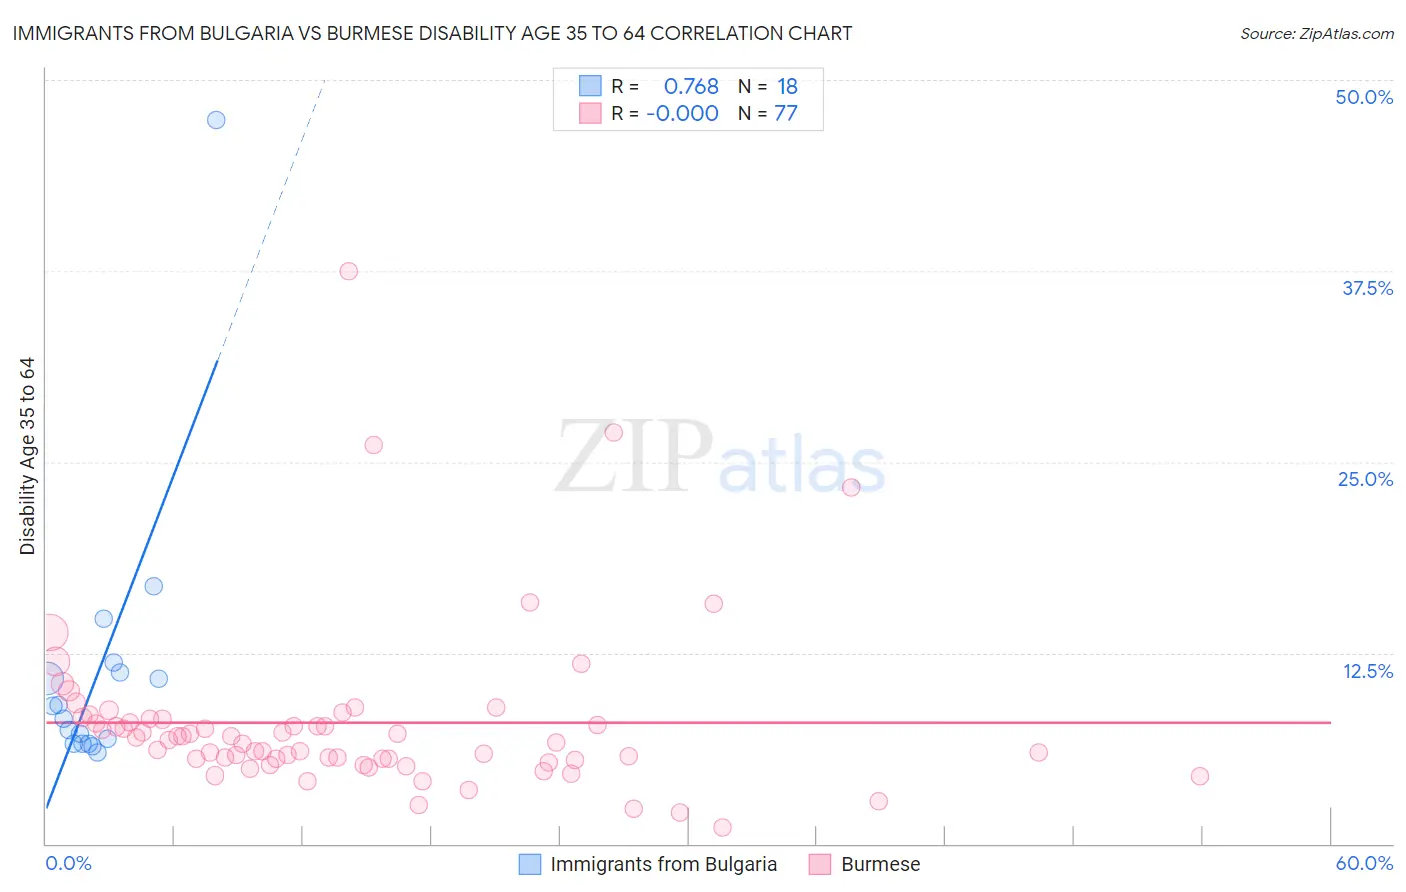
Immigrants from Bulgaria vs Burmese Disability Age 35 to 64 Correlation Chart
The statistical analysis conducted on geographies consisting of 172,533,865 people shows a strong positive correlation between the proportion of Immigrants from Bulgaria and percentage of population with a disability between the ages 34 and 64 in the United States with a correlation coefficient (R) of 0.768 and weighted average of 9.8%. Similarly, the statistical analysis conducted on geographies consisting of 464,803,120 people shows no correlation between the proportion of Burmese and percentage of population with a disability between the ages 34 and 64 in the United States with a correlation coefficient (R) of -0.000 and weighted average of 9.2%, a difference of 6.8%.
Disability Age 35 to 64 Correlation Summary
| Measurement | Immigrants from Bulgaria | Burmese |
| Minimum | 5.9% | 1.0% |
| Maximum | 47.4% | 37.5% |
| Range | 41.4% | 36.5% |
| Mean | 11.3% | 7.9% |
| Median | 8.6% | 6.8% |
| Interquartile 25% (IQ1) | 6.5% | 5.5% |
| Interquartile 75% (IQ3) | 11.2% | 8.2% |
| Interquartile Range (IQR) | 4.7% | 2.6% |
| Standard Deviation (Sample) | 9.5% | 5.6% |
| Standard Deviation (Population) | 9.2% | 5.6% |
Similar Demographics by Disability Age 35 to 64
Demographics Similar to Immigrants from Bulgaria by Disability Age 35 to 64
In terms of disability age 35 to 64, the demographic groups most similar to Immigrants from Bulgaria are Bhutanese (9.8%, a difference of 0.010%), Taiwanese (9.8%, a difference of 0.060%), Immigrants from Russia (9.8%, a difference of 0.090%), Paraguayan (9.8%, a difference of 0.10%), and Peruvian (9.9%, a difference of 0.16%).
| Demographics | Rating | Rank | Disability Age 35 to 64 |
| Immigrants | Peru | 99.9 /100 | #45 | Exceptional 9.8% |
| Cambodians | 99.8 /100 | #46 | Exceptional 9.8% |
| Immigrants | Belgium | 99.8 /100 | #47 | Exceptional 9.8% |
| Immigrants | Serbia | 99.8 /100 | #48 | Exceptional 9.8% |
| Immigrants | Greece | 99.8 /100 | #49 | Exceptional 9.8% |
| Paraguayans | 99.8 /100 | #50 | Exceptional 9.8% |
| Bhutanese | 99.8 /100 | #51 | Exceptional 9.8% |
| Immigrants | Bulgaria | 99.8 /100 | #52 | Exceptional 9.8% |
| Taiwanese | 99.8 /100 | #53 | Exceptional 9.8% |
| Immigrants | Russia | 99.8 /100 | #54 | Exceptional 9.8% |
| Peruvians | 99.8 /100 | #55 | Exceptional 9.9% |
| South Americans | 99.8 /100 | #56 | Exceptional 9.9% |
| Colombians | 99.8 /100 | #57 | Exceptional 9.9% |
| Armenians | 99.8 /100 | #58 | Exceptional 9.9% |
| Immigrants | Sweden | 99.7 /100 | #59 | Exceptional 9.9% |
Demographics Similar to Burmese by Disability Age 35 to 64
In terms of disability age 35 to 64, the demographic groups most similar to Burmese are Soviet Union (9.2%, a difference of 0.41%), Immigrants from Venezuela (9.3%, a difference of 0.65%), Immigrants from Argentina (9.3%, a difference of 1.2%), Okinawan (9.4%, a difference of 1.6%), and Cypriot (9.4%, a difference of 1.6%).
| Demographics | Rating | Rank | Disability Age 35 to 64 |
| Immigrants | Bolivia | 100.0 /100 | #10 | Exceptional 8.7% |
| Immigrants | Eastern Asia | 100.0 /100 | #11 | Exceptional 8.8% |
| Indians (Asian) | 100.0 /100 | #12 | Exceptional 8.9% |
| Immigrants | South Central Asia | 100.0 /100 | #13 | Exceptional 8.9% |
| Immigrants | Singapore | 100.0 /100 | #14 | Exceptional 8.9% |
| Bolivians | 100.0 /100 | #15 | Exceptional 8.9% |
| Immigrants | Korea | 100.0 /100 | #16 | Exceptional 9.0% |
| Burmese | 100.0 /100 | #17 | Exceptional 9.2% |
| Soviet Union | 100.0 /100 | #18 | Exceptional 9.2% |
| Immigrants | Venezuela | 100.0 /100 | #19 | Exceptional 9.3% |
| Immigrants | Argentina | 100.0 /100 | #20 | Exceptional 9.3% |
| Okinawans | 100.0 /100 | #21 | Exceptional 9.4% |
| Cypriots | 100.0 /100 | #22 | Exceptional 9.4% |
| Argentineans | 100.0 /100 | #23 | Exceptional 9.4% |
| Asians | 100.0 /100 | #24 | Exceptional 9.4% |