Immigrants from Bulgaria vs Colville Disability Age 35 to 64
COMPARE
Immigrants from Bulgaria
Colville
Disability Age 35 to 64
Disability Age 35 to 64 Comparison
Immigrants from Bulgaria
Colville
9.8%
DISABILITY AGE 35 TO 64
99.8/ 100
METRIC RATING
52nd/ 347
METRIC RANK
15.8%
DISABILITY AGE 35 TO 64
0.0/ 100
METRIC RATING
334th/ 347
METRIC RANK
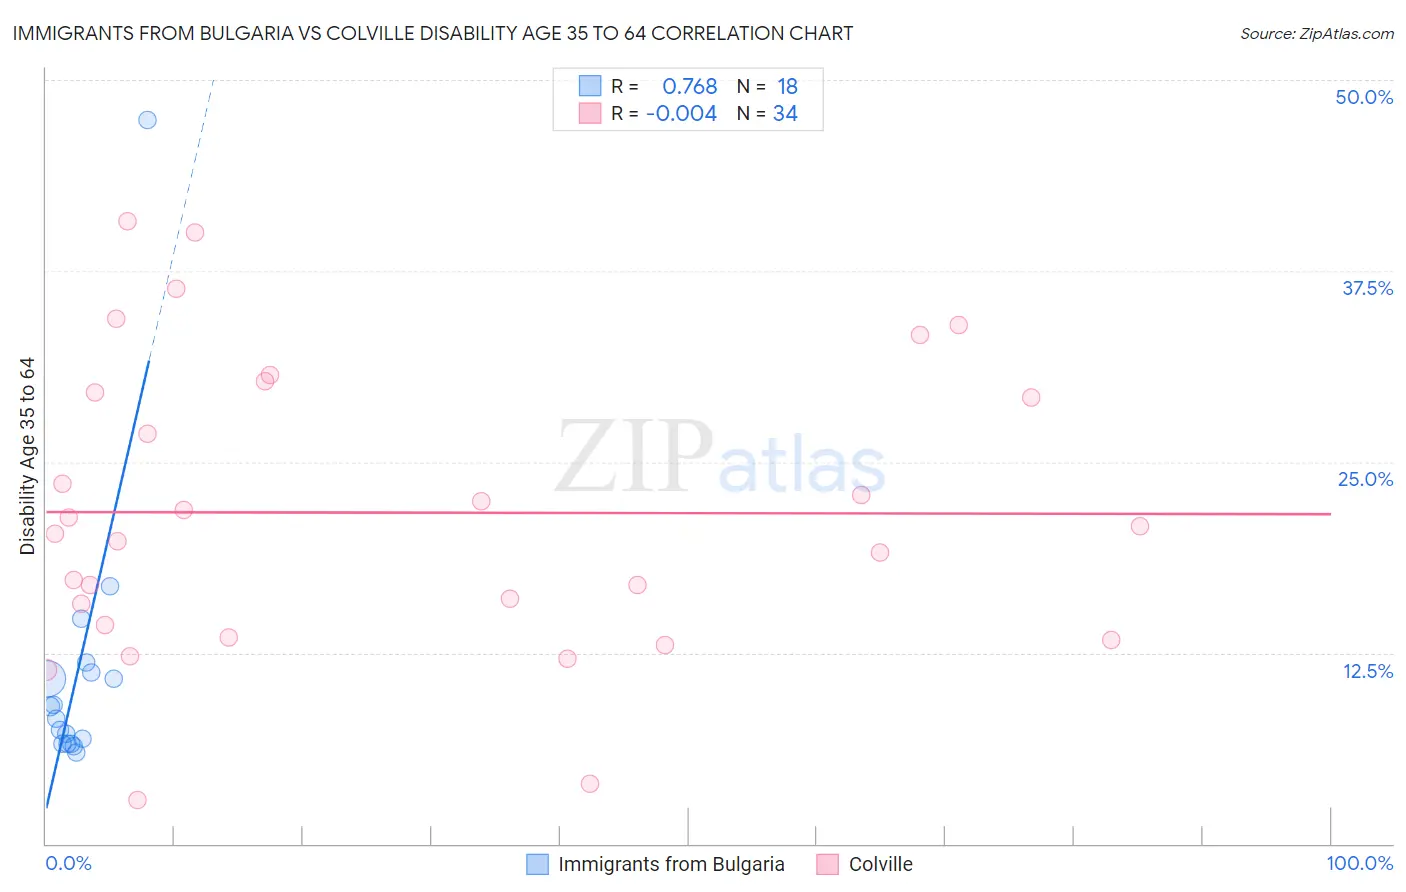
Immigrants from Bulgaria vs Colville Disability Age 35 to 64 Correlation Chart
The statistical analysis conducted on geographies consisting of 172,533,865 people shows a strong positive correlation between the proportion of Immigrants from Bulgaria and percentage of population with a disability between the ages 34 and 64 in the United States with a correlation coefficient (R) of 0.768 and weighted average of 9.8%. Similarly, the statistical analysis conducted on geographies consisting of 34,682,629 people shows no correlation between the proportion of Colville and percentage of population with a disability between the ages 34 and 64 in the United States with a correlation coefficient (R) of -0.004 and weighted average of 15.8%, a difference of 61.0%.
Disability Age 35 to 64 Correlation Summary
| Measurement | Immigrants from Bulgaria | Colville |
| Minimum | 5.9% | 2.9% |
| Maximum | 47.4% | 40.8% |
| Range | 41.4% | 37.9% |
| Mean | 11.3% | 21.7% |
| Median | 8.6% | 20.5% |
| Interquartile 25% (IQ1) | 6.5% | 14.4% |
| Interquartile 75% (IQ3) | 11.2% | 29.6% |
| Interquartile Range (IQR) | 4.7% | 15.2% |
| Standard Deviation (Sample) | 9.5% | 9.6% |
| Standard Deviation (Population) | 9.2% | 9.4% |
Similar Demographics by Disability Age 35 to 64
Demographics Similar to Immigrants from Bulgaria by Disability Age 35 to 64
In terms of disability age 35 to 64, the demographic groups most similar to Immigrants from Bulgaria are Bhutanese (9.8%, a difference of 0.010%), Taiwanese (9.8%, a difference of 0.060%), Immigrants from Russia (9.8%, a difference of 0.090%), Paraguayan (9.8%, a difference of 0.10%), and Peruvian (9.9%, a difference of 0.16%).
| Demographics | Rating | Rank | Disability Age 35 to 64 |
| Immigrants | Peru | 99.9 /100 | #45 | Exceptional 9.8% |
| Cambodians | 99.8 /100 | #46 | Exceptional 9.8% |
| Immigrants | Belgium | 99.8 /100 | #47 | Exceptional 9.8% |
| Immigrants | Serbia | 99.8 /100 | #48 | Exceptional 9.8% |
| Immigrants | Greece | 99.8 /100 | #49 | Exceptional 9.8% |
| Paraguayans | 99.8 /100 | #50 | Exceptional 9.8% |
| Bhutanese | 99.8 /100 | #51 | Exceptional 9.8% |
| Immigrants | Bulgaria | 99.8 /100 | #52 | Exceptional 9.8% |
| Taiwanese | 99.8 /100 | #53 | Exceptional 9.8% |
| Immigrants | Russia | 99.8 /100 | #54 | Exceptional 9.8% |
| Peruvians | 99.8 /100 | #55 | Exceptional 9.9% |
| South Americans | 99.8 /100 | #56 | Exceptional 9.9% |
| Colombians | 99.8 /100 | #57 | Exceptional 9.9% |
| Armenians | 99.8 /100 | #58 | Exceptional 9.9% |
| Immigrants | Sweden | 99.7 /100 | #59 | Exceptional 9.9% |
Demographics Similar to Colville by Disability Age 35 to 64
In terms of disability age 35 to 64, the demographic groups most similar to Colville are Seminole (15.9%, a difference of 0.10%), Yuman (15.8%, a difference of 0.19%), Menominee (15.9%, a difference of 0.33%), Puerto Rican (15.9%, a difference of 0.66%), and Alaskan Athabascan (15.7%, a difference of 0.75%).
| Demographics | Rating | Rank | Disability Age 35 to 64 |
| Pueblo | 0.0 /100 | #327 | Tragic 15.3% |
| Cajuns | 0.0 /100 | #328 | Tragic 15.3% |
| Cherokee | 0.0 /100 | #329 | Tragic 15.5% |
| Navajo | 0.0 /100 | #330 | Tragic 15.5% |
| Dutch West Indians | 0.0 /100 | #331 | Tragic 15.6% |
| Alaskan Athabascans | 0.0 /100 | #332 | Tragic 15.7% |
| Yuman | 0.0 /100 | #333 | Tragic 15.8% |
| Colville | 0.0 /100 | #334 | Tragic 15.8% |
| Seminole | 0.0 /100 | #335 | Tragic 15.9% |
| Menominee | 0.0 /100 | #336 | Tragic 15.9% |
| Puerto Ricans | 0.0 /100 | #337 | Tragic 15.9% |
| Chickasaw | 0.0 /100 | #338 | Tragic 16.1% |
| Pima | 0.0 /100 | #339 | Tragic 16.1% |
| Choctaw | 0.0 /100 | #340 | Tragic 16.4% |
| Tsimshian | 0.0 /100 | #341 | Tragic 16.7% |