Malaysian vs Samoan Disability Age 35 to 64
COMPARE
Malaysian
Samoan
Disability Age 35 to 64
Disability Age 35 to 64 Comparison
Malaysians
Samoans
12.5%
DISABILITY AGE 35 TO 64
0.5/ 100
METRIC RATING
261st/ 347
METRIC RANK
12.1%
DISABILITY AGE 35 TO 64
2.8/ 100
METRIC RATING
242nd/ 347
METRIC RANK
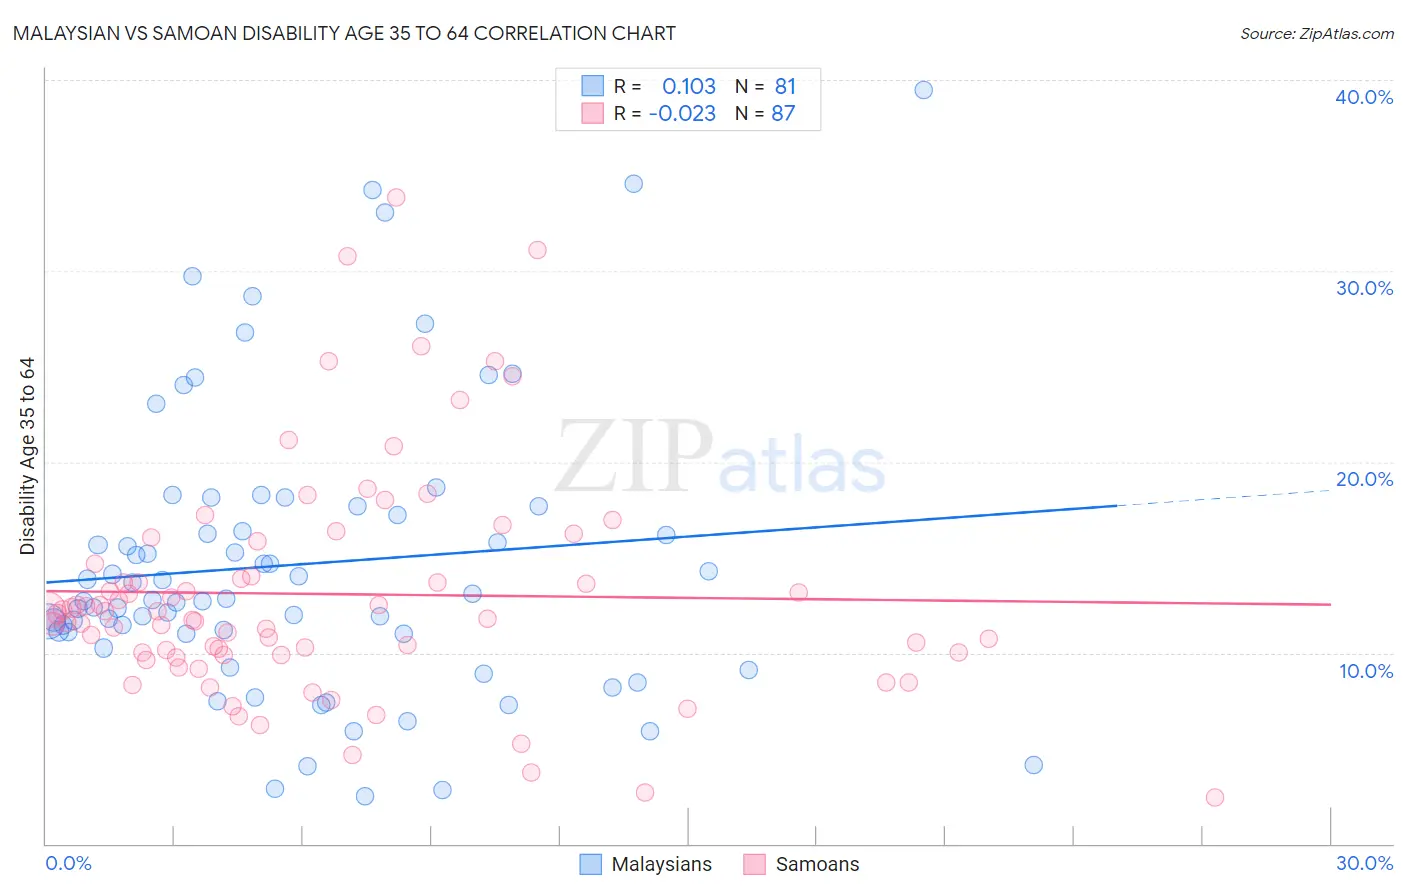
Malaysian vs Samoan Disability Age 35 to 64 Correlation Chart
The statistical analysis conducted on geographies consisting of 225,999,925 people shows a poor positive correlation between the proportion of Malaysians and percentage of population with a disability between the ages 34 and 64 in the United States with a correlation coefficient (R) of 0.103 and weighted average of 12.5%. Similarly, the statistical analysis conducted on geographies consisting of 225,063,493 people shows no correlation between the proportion of Samoans and percentage of population with a disability between the ages 34 and 64 in the United States with a correlation coefficient (R) of -0.023 and weighted average of 12.1%, a difference of 3.3%.
Disability Age 35 to 64 Correlation Summary
| Measurement | Malaysian | Samoan |
| Minimum | 2.5% | 2.4% |
| Maximum | 39.5% | 33.9% |
| Range | 37.0% | 31.4% |
| Mean | 14.6% | 13.1% |
| Median | 12.8% | 12.0% |
| Interquartile 25% (IQ1) | 11.0% | 9.9% |
| Interquartile 75% (IQ3) | 17.4% | 14.6% |
| Interquartile Range (IQR) | 6.5% | 4.7% |
| Standard Deviation (Sample) | 7.5% | 6.0% |
| Standard Deviation (Population) | 7.5% | 5.9% |
Demographics Similar to Malaysians and Samoans by Disability Age 35 to 64
In terms of disability age 35 to 64, the demographic groups most similar to Malaysians are German Russian (12.5%, a difference of 0.15%), English (12.4%, a difference of 0.40%), Welsh (12.4%, a difference of 0.52%), Mexican (12.4%, a difference of 0.61%), and Scottish (12.4%, a difference of 0.86%). Similarly, the demographic groups most similar to Samoans are Slovak (12.1%, a difference of 0.10%), Mexican American Indian (12.0%, a difference of 0.27%), Finnish (12.1%, a difference of 0.36%), Immigrants from Mexico (12.1%, a difference of 0.46%), and Guamanian/Chamorro (12.2%, a difference of 1.4%).
| Demographics | Rating | Rank | Disability Age 35 to 64 |
| Mexican American Indians | 3.2 /100 | #241 | Tragic 12.0% |
| Samoans | 2.8 /100 | #242 | Tragic 12.1% |
| Slovaks | 2.7 /100 | #243 | Tragic 12.1% |
| Finns | 2.3 /100 | #244 | Tragic 12.1% |
| Immigrants | Mexico | 2.2 /100 | #245 | Tragic 12.1% |
| Guamanians/Chamorros | 1.4 /100 | #246 | Tragic 12.2% |
| Immigrants | Senegal | 1.3 /100 | #247 | Tragic 12.2% |
| Spaniards | 1.3 /100 | #248 | Tragic 12.3% |
| Hispanics or Latinos | 1.3 /100 | #249 | Tragic 12.3% |
| Immigrants | Burma/Myanmar | 1.2 /100 | #250 | Tragic 12.3% |
| Germans | 1.1 /100 | #251 | Tragic 12.3% |
| Irish | 1.0 /100 | #252 | Tragic 12.3% |
| Dutch | 1.0 /100 | #253 | Tragic 12.3% |
| Hawaiians | 0.9 /100 | #254 | Tragic 12.3% |
| Japanese | 0.8 /100 | #255 | Tragic 12.3% |
| Scottish | 0.8 /100 | #256 | Tragic 12.4% |
| Mexicans | 0.7 /100 | #257 | Tragic 12.4% |
| Welsh | 0.6 /100 | #258 | Tragic 12.4% |
| English | 0.6 /100 | #259 | Tragic 12.4% |
| German Russians | 0.5 /100 | #260 | Tragic 12.5% |
| Malaysians | 0.5 /100 | #261 | Tragic 12.5% |