Immigrants from Bulgaria vs Immigrants from Morocco Male Disability
COMPARE
Immigrants from Bulgaria
Immigrants from Morocco
Male Disability
Male Disability Comparison
Immigrants from Bulgaria
Immigrants from Morocco
10.5%
MALE DISABILITY
99.1/ 100
METRIC RATING
70th/ 347
METRIC RANK
10.6%
MALE DISABILITY
97.7/ 100
METRIC RATING
90th/ 347
METRIC RANK
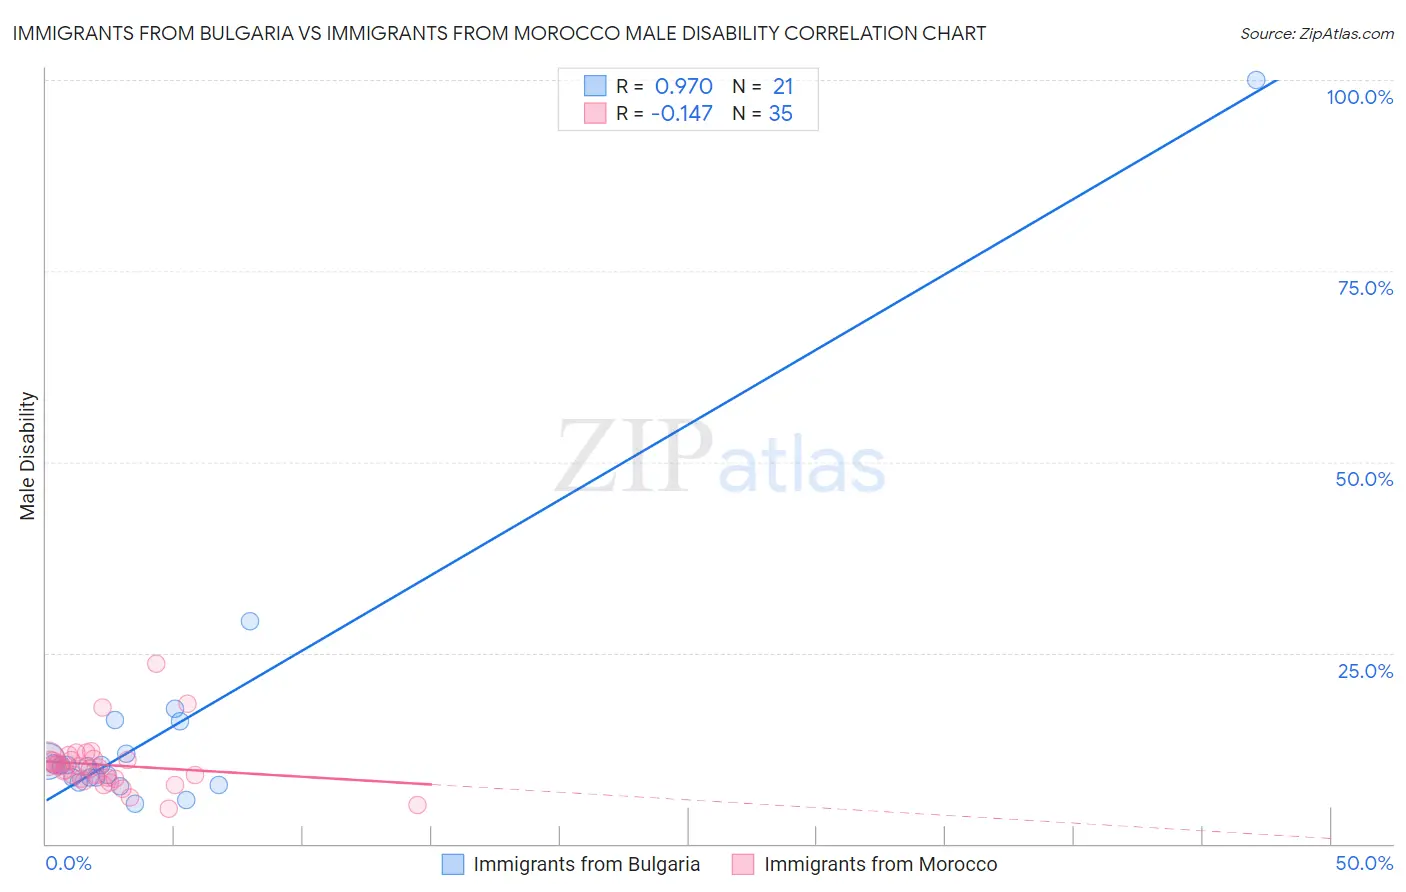
Immigrants from Bulgaria vs Immigrants from Morocco Male Disability Correlation Chart
The statistical analysis conducted on geographies consisting of 172,550,350 people shows a perfect positive correlation between the proportion of Immigrants from Bulgaria and percentage of males with a disability in the United States with a correlation coefficient (R) of 0.970 and weighted average of 10.5%. Similarly, the statistical analysis conducted on geographies consisting of 178,909,638 people shows a poor negative correlation between the proportion of Immigrants from Morocco and percentage of males with a disability in the United States with a correlation coefficient (R) of -0.147 and weighted average of 10.6%, a difference of 1.4%.
Male Disability Correlation Summary
| Measurement | Immigrants from Bulgaria | Immigrants from Morocco |
| Minimum | 5.2% | 4.6% |
| Maximum | 100.0% | 23.6% |
| Range | 94.8% | 19.0% |
| Mean | 15.4% | 10.3% |
| Median | 10.3% | 10.0% |
| Interquartile 25% (IQ1) | 8.3% | 8.5% |
| Interquartile 75% (IQ3) | 14.0% | 11.1% |
| Interquartile Range (IQR) | 5.7% | 2.5% |
| Standard Deviation (Sample) | 20.1% | 3.6% |
| Standard Deviation (Population) | 19.6% | 3.5% |
Demographics Similar to Immigrants from Bulgaria and Immigrants from Morocco by Male Disability
In terms of male disability, the demographic groups most similar to Immigrants from Bulgaria are Immigrants from Cameroon (10.5%, a difference of 0.15%), Immigrants from Serbia (10.5%, a difference of 0.20%), Immigrants from Lithuania (10.5%, a difference of 0.27%), Immigrants from Lebanon (10.5%, a difference of 0.41%), and Sierra Leonean (10.5%, a difference of 0.53%). Similarly, the demographic groups most similar to Immigrants from Morocco are Immigrants from Western Asia (10.6%, a difference of 0.050%), Immigrants from Nicaragua (10.6%, a difference of 0.050%), Immigrants from Vietnam (10.6%, a difference of 0.12%), Immigrants from Ireland (10.6%, a difference of 0.14%), and Sri Lankan (10.6%, a difference of 0.15%).
| Demographics | Rating | Rank | Male Disability |
| Immigrants | Bulgaria | 99.1 /100 | #70 | Exceptional 10.5% |
| Immigrants | Cameroon | 99.0 /100 | #71 | Exceptional 10.5% |
| Immigrants | Serbia | 99.0 /100 | #72 | Exceptional 10.5% |
| Immigrants | Lithuania | 98.9 /100 | #73 | Exceptional 10.5% |
| Immigrants | Lebanon | 98.8 /100 | #74 | Exceptional 10.5% |
| Sierra Leoneans | 98.7 /100 | #75 | Exceptional 10.5% |
| Immigrants | Sierra Leone | 98.7 /100 | #76 | Exceptional 10.5% |
| Laotians | 98.6 /100 | #77 | Exceptional 10.6% |
| Immigrants | Russia | 98.6 /100 | #78 | Exceptional 10.6% |
| Zimbabweans | 98.4 /100 | #79 | Exceptional 10.6% |
| Immigrants | Jordan | 98.4 /100 | #80 | Exceptional 10.6% |
| Immigrants | Chile | 98.3 /100 | #81 | Exceptional 10.6% |
| Immigrants | Guyana | 98.2 /100 | #82 | Exceptional 10.6% |
| Immigrants | Poland | 98.1 /100 | #83 | Exceptional 10.6% |
| Bulgarians | 98.1 /100 | #84 | Exceptional 10.6% |
| Sri Lankans | 97.9 /100 | #85 | Exceptional 10.6% |
| Immigrants | Ireland | 97.9 /100 | #86 | Exceptional 10.6% |
| Immigrants | Vietnam | 97.9 /100 | #87 | Exceptional 10.6% |
| Immigrants | Western Asia | 97.8 /100 | #88 | Exceptional 10.6% |
| Immigrants | Nicaragua | 97.8 /100 | #89 | Exceptional 10.6% |
| Immigrants | Morocco | 97.7 /100 | #90 | Exceptional 10.6% |