Immigrants from Bolivia vs Immigrants from Southern Europe Vision Disability
COMPARE
Immigrants from Bolivia
Immigrants from Southern Europe
Vision Disability
Vision Disability Comparison
Immigrants from Bolivia
Immigrants from Southern Europe
1.8%
VISION DISABILITY
100.0/ 100
METRIC RATING
15th/ 347
METRIC RANK
2.1%
VISION DISABILITY
74.6/ 100
METRIC RATING
152nd/ 347
METRIC RANK
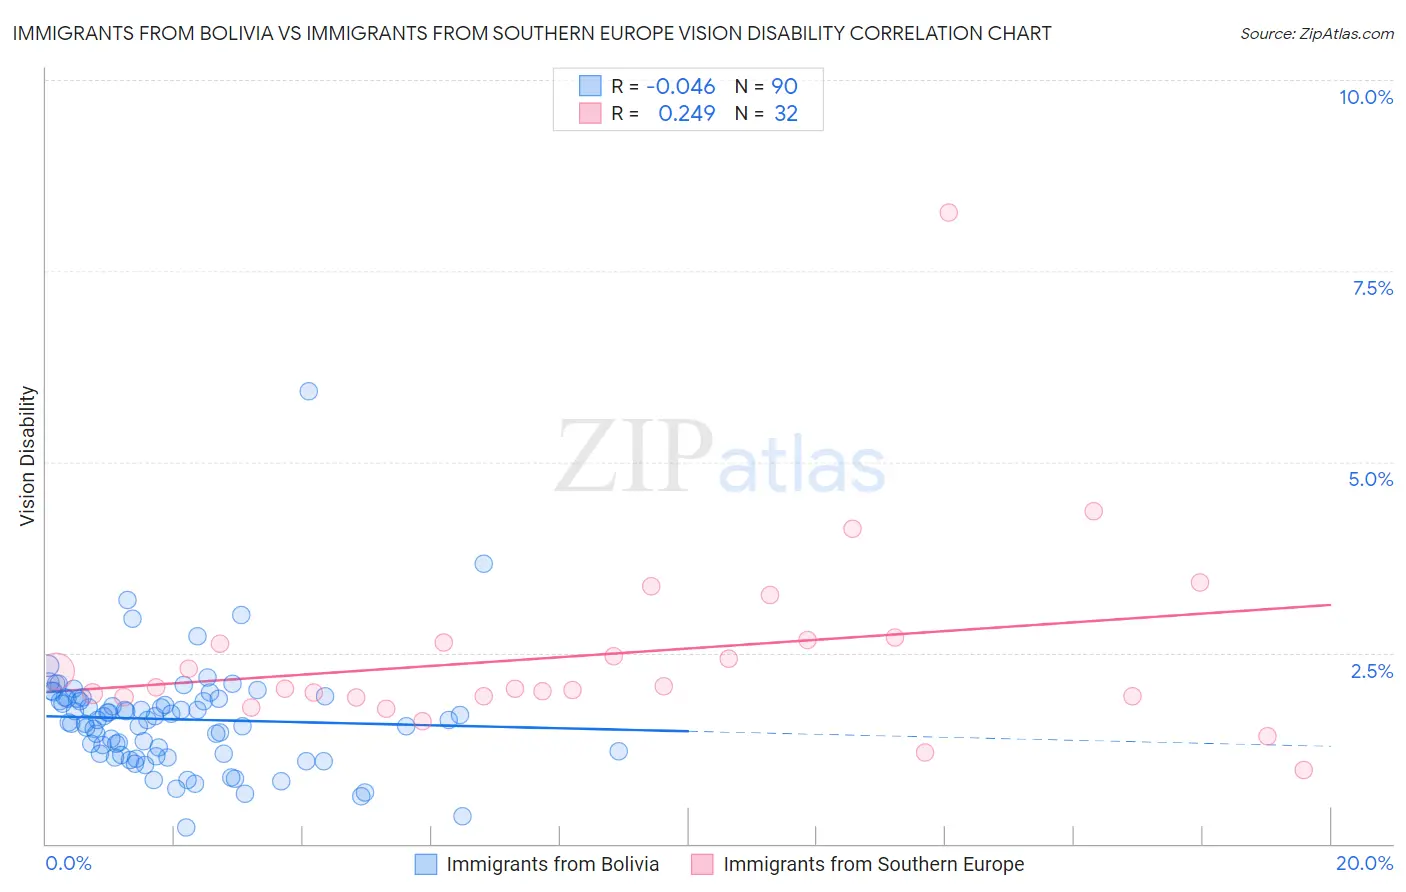
Immigrants from Bolivia vs Immigrants from Southern Europe Vision Disability Correlation Chart
The statistical analysis conducted on geographies consisting of 158,695,494 people shows no correlation between the proportion of Immigrants from Bolivia and percentage of population with vision disability in the United States with a correlation coefficient (R) of -0.046 and weighted average of 1.8%. Similarly, the statistical analysis conducted on geographies consisting of 402,373,395 people shows a weak positive correlation between the proportion of Immigrants from Southern Europe and percentage of population with vision disability in the United States with a correlation coefficient (R) of 0.249 and weighted average of 2.1%, a difference of 15.7%.
Vision Disability Correlation Summary
| Measurement | Immigrants from Bolivia | Immigrants from Southern Europe |
| Minimum | 0.21% | 0.96% |
| Maximum | 5.9% | 8.3% |
| Range | 5.7% | 7.3% |
| Mean | 1.6% | 2.5% |
| Median | 1.6% | 2.0% |
| Interquartile 25% (IQ1) | 1.2% | 1.9% |
| Interquartile 75% (IQ3) | 1.9% | 2.7% |
| Interquartile Range (IQR) | 0.72% | 0.73% |
| Standard Deviation (Sample) | 0.74% | 1.3% |
| Standard Deviation (Population) | 0.74% | 1.3% |
Similar Demographics by Vision Disability
Demographics Similar to Immigrants from Bolivia by Vision Disability
In terms of vision disability, the demographic groups most similar to Immigrants from Bolivia are Immigrants from China (1.8%, a difference of 0.42%), Indian (Asian) (1.8%, a difference of 0.44%), Burmese (1.8%, a difference of 0.45%), Immigrants from Eastern Asia (1.8%, a difference of 0.57%), and Immigrants from Korea (1.8%, a difference of 0.65%).
| Demographics | Rating | Rank | Vision Disability |
| Iranians | 100.0 /100 | #8 | Exceptional 1.8% |
| Immigrants | Singapore | 100.0 /100 | #9 | Exceptional 1.8% |
| Immigrants | Hong Kong | 100.0 /100 | #10 | Exceptional 1.8% |
| Immigrants | Israel | 100.0 /100 | #11 | Exceptional 1.8% |
| Immigrants | Korea | 100.0 /100 | #12 | Exceptional 1.8% |
| Immigrants | Eastern Asia | 100.0 /100 | #13 | Exceptional 1.8% |
| Immigrants | China | 100.0 /100 | #14 | Exceptional 1.8% |
| Immigrants | Bolivia | 100.0 /100 | #15 | Exceptional 1.8% |
| Indians (Asian) | 100.0 /100 | #16 | Exceptional 1.8% |
| Burmese | 100.0 /100 | #17 | Exceptional 1.8% |
| Bolivians | 100.0 /100 | #18 | Exceptional 1.9% |
| Immigrants | Sri Lanka | 100.0 /100 | #19 | Exceptional 1.9% |
| Asians | 100.0 /100 | #20 | Exceptional 1.9% |
| Turks | 100.0 /100 | #21 | Exceptional 1.9% |
| Immigrants | Pakistan | 100.0 /100 | #22 | Exceptional 1.9% |
Demographics Similar to Immigrants from Southern Europe by Vision Disability
In terms of vision disability, the demographic groups most similar to Immigrants from Southern Europe are Immigrants from South America (2.1%, a difference of 0.070%), Immigrants from Norway (2.1%, a difference of 0.080%), Slovene (2.1%, a difference of 0.080%), Belgian (2.1%, a difference of 0.11%), and Colombian (2.1%, a difference of 0.14%).
| Demographics | Rating | Rank | Vision Disability |
| Immigrants | Bosnia and Herzegovina | 81.5 /100 | #145 | Excellent 2.1% |
| Italians | 79.7 /100 | #146 | Good 2.1% |
| Immigrants | Sudan | 78.4 /100 | #147 | Good 2.1% |
| Finns | 78.3 /100 | #148 | Good 2.1% |
| Colombians | 76.2 /100 | #149 | Good 2.1% |
| Belgians | 75.9 /100 | #150 | Good 2.1% |
| Immigrants | Norway | 75.5 /100 | #151 | Good 2.1% |
| Immigrants | Southern Europe | 74.6 /100 | #152 | Good 2.1% |
| Immigrants | South America | 73.8 /100 | #153 | Good 2.1% |
| Slovenes | 73.6 /100 | #154 | Good 2.1% |
| Immigrants | Colombia | 72.1 /100 | #155 | Good 2.1% |
| Pakistanis | 71.6 /100 | #156 | Good 2.1% |
| Serbians | 70.2 /100 | #157 | Good 2.1% |
| Immigrants | Uzbekistan | 69.9 /100 | #158 | Good 2.1% |
| South Africans | 69.8 /100 | #159 | Good 2.1% |