Immigrants from Bolivia vs Filipino In Labor Force | Age 16-19
COMPARE
Immigrants from Bolivia
Filipino
In Labor Force | Age 16-19
In Labor Force | Age 16-19 Comparison
Immigrants from Bolivia
Filipinos
35.6%
IN LABOR FORCE | AGE 16-19
11.0/ 100
METRIC RATING
213th/ 347
METRIC RANK
31.7%
IN LABOR FORCE | AGE 16-19
0.0/ 100
METRIC RATING
316th/ 347
METRIC RANK
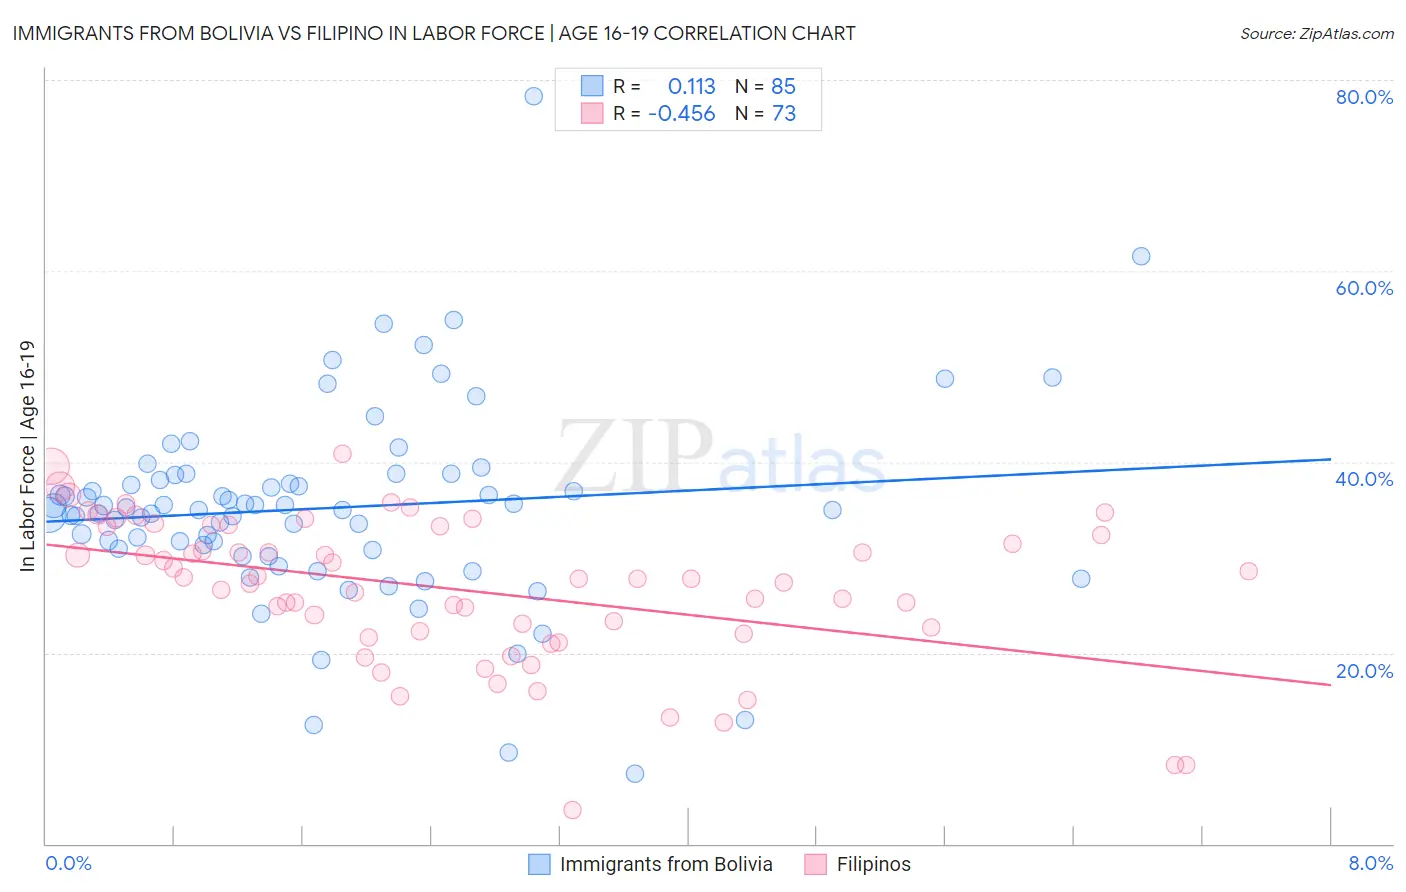
Immigrants from Bolivia vs Filipino In Labor Force | Age 16-19 Correlation Chart
The statistical analysis conducted on geographies consisting of 158,606,636 people shows a poor positive correlation between the proportion of Immigrants from Bolivia and labor force participation rate among population between the ages 16 and 19 in the United States with a correlation coefficient (R) of 0.113 and weighted average of 35.6%. Similarly, the statistical analysis conducted on geographies consisting of 254,095,508 people shows a moderate negative correlation between the proportion of Filipinos and labor force participation rate among population between the ages 16 and 19 in the United States with a correlation coefficient (R) of -0.456 and weighted average of 31.7%, a difference of 12.4%.
In Labor Force | Age 16-19 Correlation Summary
| Measurement | Immigrants from Bolivia | Filipino |
| Minimum | 7.3% | 3.5% |
| Maximum | 78.3% | 40.8% |
| Range | 71.0% | 37.3% |
| Mean | 35.2% | 26.6% |
| Median | 34.9% | 27.8% |
| Interquartile 25% (IQ1) | 30.9% | 22.1% |
| Interquartile 75% (IQ3) | 38.4% | 33.2% |
| Interquartile Range (IQR) | 7.5% | 11.1% |
| Standard Deviation (Sample) | 10.4% | 7.7% |
| Standard Deviation (Population) | 10.3% | 7.6% |
Similar Demographics by In Labor Force | Age 16-19
Demographics Similar to Immigrants from Bolivia by In Labor Force | Age 16-19
In terms of in labor force | age 16-19, the demographic groups most similar to Immigrants from Bolivia are Houma (35.6%, a difference of 0.0%), Apache (35.6%, a difference of 0.010%), Immigrants from South Eastern Asia (35.6%, a difference of 0.030%), Dutch West Indian (35.6%, a difference of 0.050%), and Immigrants from Costa Rica (35.6%, a difference of 0.050%).
| Demographics | Rating | Rank | In Labor Force | Age 16-19 |
| Chileans | 14.6 /100 | #206 | Poor 35.8% |
| Immigrants | Eastern Europe | 14.5 /100 | #207 | Poor 35.8% |
| Koreans | 13.3 /100 | #208 | Poor 35.7% |
| Moroccans | 12.7 /100 | #209 | Poor 35.7% |
| Immigrants | Switzerland | 11.9 /100 | #210 | Poor 35.6% |
| Mexicans | 11.9 /100 | #211 | Poor 35.6% |
| Houma | 11.0 /100 | #212 | Poor 35.6% |
| Immigrants | Bolivia | 11.0 /100 | #213 | Poor 35.6% |
| Apache | 11.0 /100 | #214 | Poor 35.6% |
| Immigrants | South Eastern Asia | 10.8 /100 | #215 | Poor 35.6% |
| Dutch West Indians | 10.7 /100 | #216 | Poor 35.6% |
| Immigrants | Costa Rica | 10.7 /100 | #217 | Poor 35.6% |
| Sri Lankans | 9.8 /100 | #218 | Tragic 35.5% |
| Guatemalans | 8.6 /100 | #219 | Tragic 35.5% |
| Immigrants | Bahamas | 8.3 /100 | #220 | Tragic 35.5% |
Demographics Similar to Filipinos by In Labor Force | Age 16-19
In terms of in labor force | age 16-19, the demographic groups most similar to Filipinos are Immigrants from West Indies (31.7%, a difference of 0.080%), Immigrants from Nicaragua (31.6%, a difference of 0.19%), Cuban (31.8%, a difference of 0.26%), Hopi (31.8%, a difference of 0.42%), and Immigrants from Belize (31.8%, a difference of 0.43%).
| Demographics | Rating | Rank | In Labor Force | Age 16-19 |
| Immigrants | Eastern Asia | 0.0 /100 | #309 | Tragic 32.0% |
| Immigrants | Iran | 0.0 /100 | #310 | Tragic 32.0% |
| Indians (Asian) | 0.0 /100 | #311 | Tragic 31.9% |
| Immigrants | Belize | 0.0 /100 | #312 | Tragic 31.8% |
| Hopi | 0.0 /100 | #313 | Tragic 31.8% |
| Cubans | 0.0 /100 | #314 | Tragic 31.8% |
| Immigrants | West Indies | 0.0 /100 | #315 | Tragic 31.7% |
| Filipinos | 0.0 /100 | #316 | Tragic 31.7% |
| Immigrants | Nicaragua | 0.0 /100 | #317 | Tragic 31.6% |
| Immigrants | Yemen | 0.0 /100 | #318 | Tragic 31.5% |
| Soviet Union | 0.0 /100 | #319 | Tragic 31.4% |
| Ecuadorians | 0.0 /100 | #320 | Tragic 31.4% |
| West Indians | 0.0 /100 | #321 | Tragic 31.3% |
| Tohono O'odham | 0.0 /100 | #322 | Tragic 31.3% |
| Immigrants | Caribbean | 0.0 /100 | #323 | Tragic 31.2% |