Immigrants from Bolivia vs Filipino Master's Degree
COMPARE
Immigrants from Bolivia
Filipino
Master's Degree
Master's Degree Comparison
Immigrants from Bolivia
Filipinos
19.1%
MASTER'S DEGREE
100.0/ 100
METRIC RATING
40th/ 347
METRIC RANK
23.4%
MASTER'S DEGREE
100.0/ 100
METRIC RATING
2nd/ 347
METRIC RANK
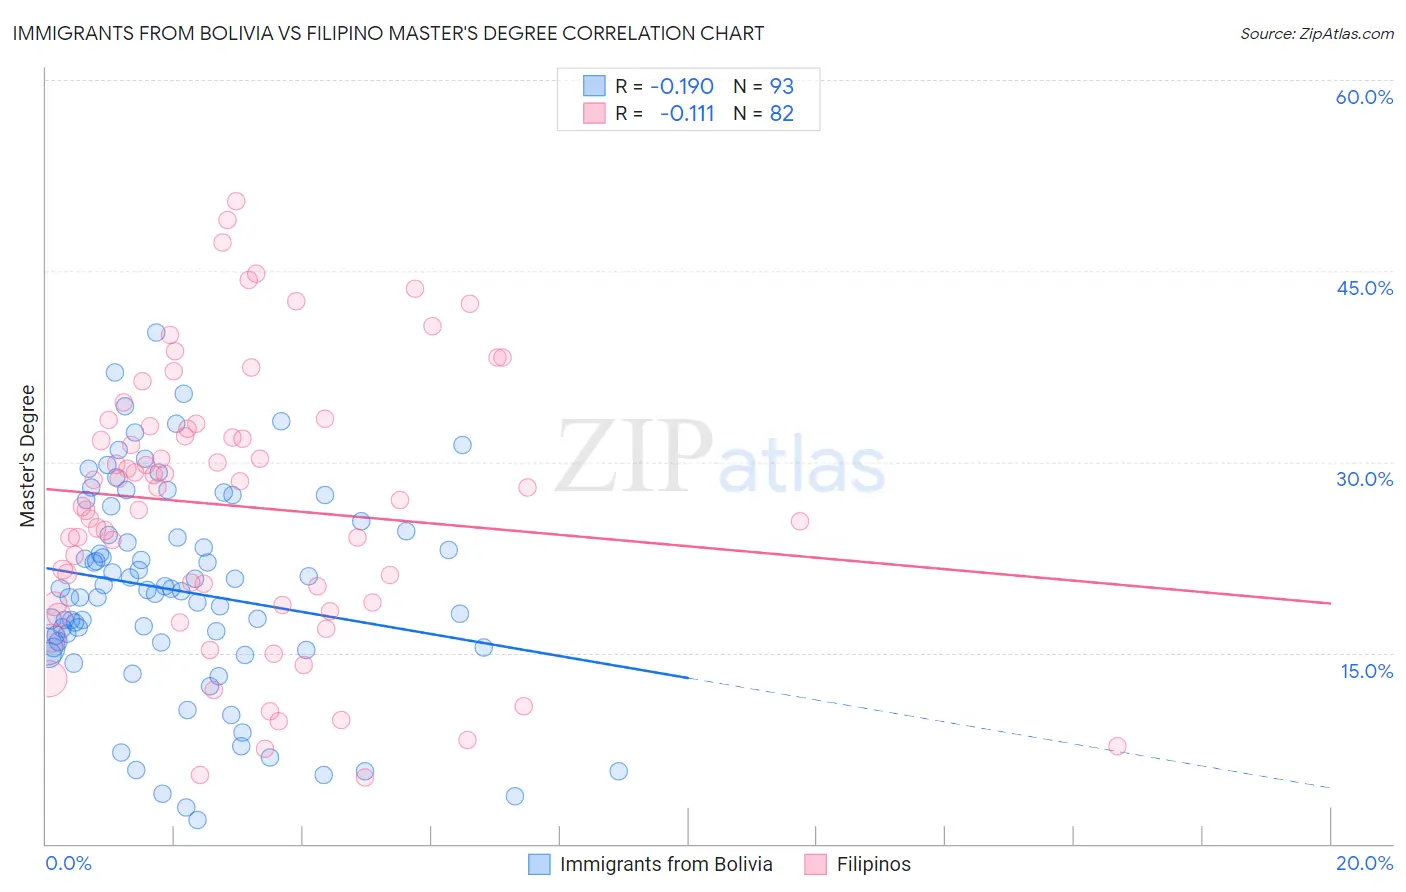
Immigrants from Bolivia vs Filipino Master's Degree Correlation Chart
The statistical analysis conducted on geographies consisting of 158,724,078 people shows a poor negative correlation between the proportion of Immigrants from Bolivia and percentage of population with at least master's degree education in the United States with a correlation coefficient (R) of -0.190 and weighted average of 19.1%. Similarly, the statistical analysis conducted on geographies consisting of 254,302,816 people shows a poor negative correlation between the proportion of Filipinos and percentage of population with at least master's degree education in the United States with a correlation coefficient (R) of -0.111 and weighted average of 23.4%, a difference of 22.4%.
Master's Degree Correlation Summary
| Measurement | Immigrants from Bolivia | Filipino |
| Minimum | 1.9% | 5.2% |
| Maximum | 40.2% | 50.5% |
| Range | 38.3% | 45.2% |
| Mean | 19.9% | 26.5% |
| Median | 19.9% | 27.5% |
| Interquartile 25% (IQ1) | 15.5% | 18.8% |
| Interquartile 75% (IQ3) | 25.0% | 32.8% |
| Interquartile Range (IQR) | 9.5% | 14.0% |
| Standard Deviation (Sample) | 8.2% | 10.7% |
| Standard Deviation (Population) | 8.2% | 10.6% |
Similar Demographics by Master's Degree
Demographics Similar to Immigrants from Bolivia by Master's Degree
In terms of master's degree, the demographic groups most similar to Immigrants from Bolivia are Immigrants from Spain (19.1%, a difference of 0.13%), Immigrants from Latvia (19.1%, a difference of 0.35%), Bolivian (19.3%, a difference of 0.77%), Immigrants from Saudi Arabia (19.0%, a difference of 0.78%), and Immigrants from Greece (19.0%, a difference of 0.79%).
| Demographics | Rating | Rank | Master's Degree |
| Russians | 100.0 /100 | #33 | Exceptional 19.5% |
| Immigrants | Denmark | 100.0 /100 | #34 | Exceptional 19.5% |
| Immigrants | Northern Europe | 100.0 /100 | #35 | Exceptional 19.5% |
| Immigrants | Russia | 100.0 /100 | #36 | Exceptional 19.4% |
| Mongolians | 100.0 /100 | #37 | Exceptional 19.4% |
| Bolivians | 100.0 /100 | #38 | Exceptional 19.3% |
| Immigrants | Spain | 100.0 /100 | #39 | Exceptional 19.1% |
| Immigrants | Bolivia | 100.0 /100 | #40 | Exceptional 19.1% |
| Immigrants | Latvia | 100.0 /100 | #41 | Exceptional 19.1% |
| Immigrants | Saudi Arabia | 100.0 /100 | #42 | Exceptional 19.0% |
| Immigrants | Greece | 100.0 /100 | #43 | Exceptional 19.0% |
| Immigrants | Malaysia | 100.0 /100 | #44 | Exceptional 18.9% |
| Immigrants | Belarus | 100.0 /100 | #45 | Exceptional 18.9% |
| Immigrants | Norway | 100.0 /100 | #46 | Exceptional 18.8% |
| Immigrants | Austria | 100.0 /100 | #47 | Exceptional 18.8% |
Demographics Similar to Filipinos by Master's Degree
In terms of master's degree, the demographic groups most similar to Filipinos are Immigrants from Singapore (23.4%, a difference of 0.050%), Immigrants from Israel (22.6%, a difference of 3.4%), Okinawan (22.6%, a difference of 3.4%), Immigrants from Taiwan (22.5%, a difference of 4.2%), and Immigrants from India (22.3%, a difference of 4.9%).
| Demographics | Rating | Rank | Master's Degree |
| Immigrants | Singapore | 100.0 /100 | #1 | Exceptional 23.4% |
| Filipinos | 100.0 /100 | #2 | Exceptional 23.4% |
| Immigrants | Israel | 100.0 /100 | #3 | Exceptional 22.6% |
| Okinawans | 100.0 /100 | #4 | Exceptional 22.6% |
| Immigrants | Taiwan | 100.0 /100 | #5 | Exceptional 22.5% |
| Immigrants | India | 100.0 /100 | #6 | Exceptional 22.3% |
| Iranians | 100.0 /100 | #7 | Exceptional 22.3% |
| Cypriots | 100.0 /100 | #8 | Exceptional 21.8% |
| Thais | 100.0 /100 | #9 | Exceptional 21.7% |
| Immigrants | Iran | 100.0 /100 | #10 | Exceptional 21.6% |
| Immigrants | China | 100.0 /100 | #11 | Exceptional 21.2% |
| Eastern Europeans | 100.0 /100 | #12 | Exceptional 21.1% |
| Immigrants | Australia | 100.0 /100 | #13 | Exceptional 20.9% |
| Immigrants | Switzerland | 100.0 /100 | #14 | Exceptional 20.9% |
| Immigrants | Eastern Asia | 100.0 /100 | #15 | Exceptional 20.8% |