Immigrants from Belize vs Portuguese Vision Disability
COMPARE
Immigrants from Belize
Portuguese
Vision Disability
Vision Disability Comparison
Immigrants from Belize
Portuguese
2.4%
VISION DISABILITY
0.1/ 100
METRIC RATING
263rd/ 347
METRIC RANK
2.3%
VISION DISABILITY
4.9/ 100
METRIC RATING
218th/ 347
METRIC RANK
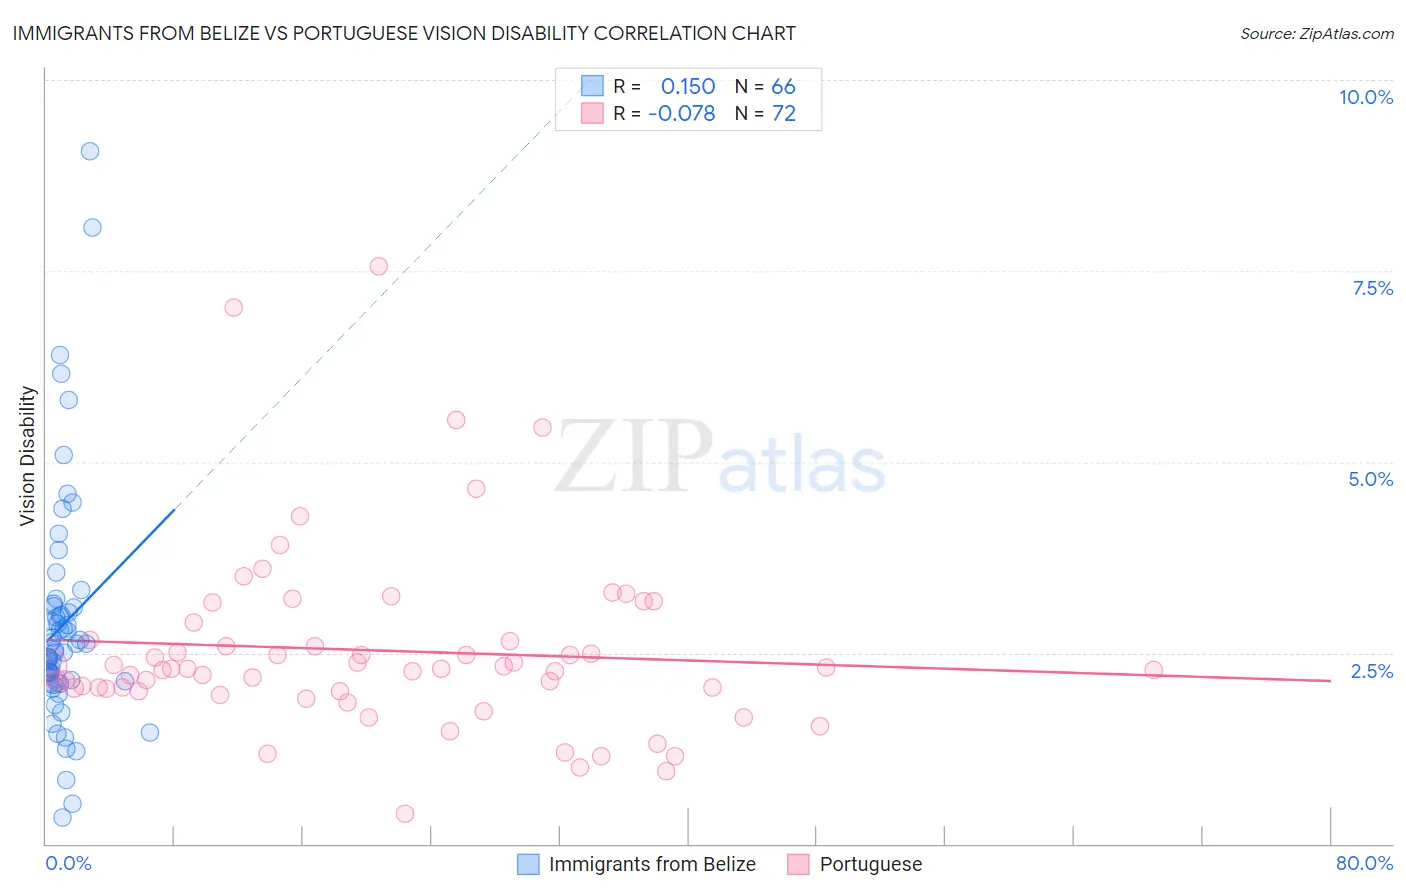
Immigrants from Belize vs Portuguese Vision Disability Correlation Chart
The statistical analysis conducted on geographies consisting of 130,278,815 people shows a poor positive correlation between the proportion of Immigrants from Belize and percentage of population with vision disability in the United States with a correlation coefficient (R) of 0.150 and weighted average of 2.4%. Similarly, the statistical analysis conducted on geographies consisting of 449,734,569 people shows a slight negative correlation between the proportion of Portuguese and percentage of population with vision disability in the United States with a correlation coefficient (R) of -0.078 and weighted average of 2.3%, a difference of 5.6%.
Vision Disability Correlation Summary
| Measurement | Immigrants from Belize | Portuguese |
| Minimum | 0.34% | 0.39% |
| Maximum | 9.1% | 7.6% |
| Range | 8.7% | 7.2% |
| Mean | 2.9% | 2.5% |
| Median | 2.5% | 2.3% |
| Interquartile 25% (IQ1) | 2.1% | 2.0% |
| Interquartile 75% (IQ3) | 3.1% | 2.7% |
| Interquartile Range (IQR) | 0.99% | 0.65% |
| Standard Deviation (Sample) | 1.5% | 1.2% |
| Standard Deviation (Population) | 1.5% | 1.2% |
Similar Demographics by Vision Disability
Demographics Similar to Immigrants from Belize by Vision Disability
In terms of vision disability, the demographic groups most similar to Immigrants from Belize are Immigrants from Liberia (2.4%, a difference of 0.12%), Immigrants from Jamaica (2.4%, a difference of 0.14%), Mexican American Indian (2.4%, a difference of 0.19%), Ute (2.4%, a difference of 0.20%), and Jamaican (2.4%, a difference of 0.26%).
| Demographics | Rating | Rank | Vision Disability |
| Immigrants | Haiti | 0.2 /100 | #256 | Tragic 2.4% |
| West Indians | 0.2 /100 | #257 | Tragic 2.4% |
| British West Indians | 0.2 /100 | #258 | Tragic 2.4% |
| Whites/Caucasians | 0.2 /100 | #259 | Tragic 2.4% |
| Belizeans | 0.2 /100 | #260 | Tragic 2.4% |
| Fijians | 0.1 /100 | #261 | Tragic 2.4% |
| Jamaicans | 0.1 /100 | #262 | Tragic 2.4% |
| Immigrants | Belize | 0.1 /100 | #263 | Tragic 2.4% |
| Immigrants | Liberia | 0.1 /100 | #264 | Tragic 2.4% |
| Immigrants | Jamaica | 0.1 /100 | #265 | Tragic 2.4% |
| Mexican American Indians | 0.1 /100 | #266 | Tragic 2.4% |
| Ute | 0.1 /100 | #267 | Tragic 2.4% |
| Senegalese | 0.1 /100 | #268 | Tragic 2.4% |
| Celtics | 0.1 /100 | #269 | Tragic 2.4% |
| Cubans | 0.1 /100 | #270 | Tragic 2.4% |
Demographics Similar to Portuguese by Vision Disability
In terms of vision disability, the demographic groups most similar to Portuguese are Barbadian (2.3%, a difference of 0.070%), Ecuadorian (2.3%, a difference of 0.11%), Immigrants from Trinidad and Tobago (2.3%, a difference of 0.34%), Guamanian/Chamorro (2.3%, a difference of 0.35%), and French Canadian (2.3%, a difference of 0.36%).
| Demographics | Rating | Rank | Vision Disability |
| Indonesians | 9.5 /100 | #211 | Tragic 2.2% |
| Bermudans | 9.0 /100 | #212 | Tragic 2.2% |
| Immigrants | Ghana | 8.9 /100 | #213 | Tragic 2.2% |
| Trinidadians and Tobagonians | 8.2 /100 | #214 | Tragic 2.2% |
| Nigerians | 7.2 /100 | #215 | Tragic 2.3% |
| Immigrants | Trinidad and Tobago | 6.1 /100 | #216 | Tragic 2.3% |
| Barbadians | 5.1 /100 | #217 | Tragic 2.3% |
| Portuguese | 4.9 /100 | #218 | Tragic 2.3% |
| Ecuadorians | 4.6 /100 | #219 | Tragic 2.3% |
| Guamanians/Chamorros | 3.9 /100 | #220 | Tragic 2.3% |
| French Canadians | 3.9 /100 | #221 | Tragic 2.3% |
| Immigrants | Senegal | 3.8 /100 | #222 | Tragic 2.3% |
| Basques | 3.5 /100 | #223 | Tragic 2.3% |
| Irish | 3.4 /100 | #224 | Tragic 2.3% |
| Immigrants | Western Africa | 3.4 /100 | #225 | Tragic 2.3% |