Immigrants from Belize vs Immigrants from Uzbekistan Self-Care Disability
COMPARE
Immigrants from Belize
Immigrants from Uzbekistan
Self-Care Disability
Self-Care Disability Comparison
Immigrants from Belize
Immigrants from Uzbekistan
2.8%
SELF-CARE DISABILITY
0.0/ 100
METRIC RATING
303rd/ 347
METRIC RANK
2.9%
SELF-CARE DISABILITY
0.0/ 100
METRIC RATING
325th/ 347
METRIC RANK
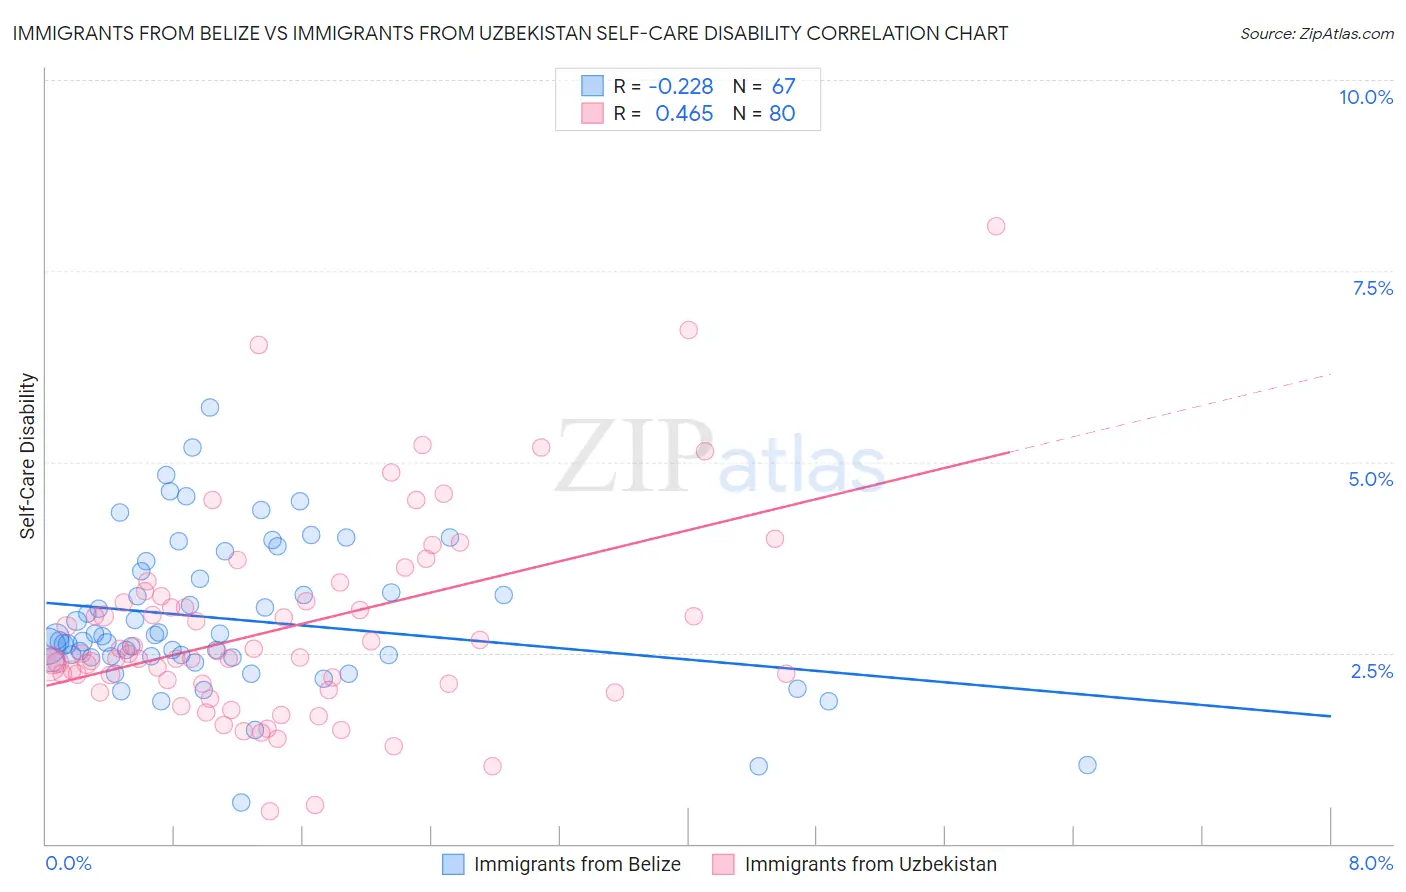
Immigrants from Belize vs Immigrants from Uzbekistan Self-Care Disability Correlation Chart
The statistical analysis conducted on geographies consisting of 130,238,734 people shows a weak negative correlation between the proportion of Immigrants from Belize and percentage of population with self-care disability in the United States with a correlation coefficient (R) of -0.228 and weighted average of 2.8%. Similarly, the statistical analysis conducted on geographies consisting of 118,703,600 people shows a moderate positive correlation between the proportion of Immigrants from Uzbekistan and percentage of population with self-care disability in the United States with a correlation coefficient (R) of 0.465 and weighted average of 2.9%, a difference of 3.9%.
Self-Care Disability Correlation Summary
| Measurement | Immigrants from Belize | Immigrants from Uzbekistan |
| Minimum | 0.53% | 0.43% |
| Maximum | 5.7% | 8.1% |
| Range | 5.2% | 7.6% |
| Mean | 2.9% | 2.8% |
| Median | 2.7% | 2.5% |
| Interquartile 25% (IQ1) | 2.4% | 2.1% |
| Interquartile 75% (IQ3) | 3.6% | 3.2% |
| Interquartile Range (IQR) | 1.1% | 1.1% |
| Standard Deviation (Sample) | 0.98% | 1.3% |
| Standard Deviation (Population) | 0.97% | 1.3% |
Similar Demographics by Self-Care Disability
Demographics Similar to Immigrants from Belize by Self-Care Disability
In terms of self-care disability, the demographic groups most similar to Immigrants from Belize are Immigrants from St. Vincent and the Grenadines (2.8%, a difference of 0.15%), Cree (2.8%, a difference of 0.16%), Pima (2.8%, a difference of 0.18%), Immigrants from West Indies (2.8%, a difference of 0.20%), and Immigrants from Fiji (2.8%, a difference of 0.28%).
| Demographics | Rating | Rank | Self-Care Disability |
| Immigrants | Portugal | 0.0 /100 | #296 | Tragic 2.8% |
| West Indians | 0.0 /100 | #297 | Tragic 2.8% |
| Americans | 0.0 /100 | #298 | Tragic 2.8% |
| Immigrants | Guyana | 0.0 /100 | #299 | Tragic 2.8% |
| Immigrants | Fiji | 0.0 /100 | #300 | Tragic 2.8% |
| Pima | 0.0 /100 | #301 | Tragic 2.8% |
| Immigrants | St. Vincent and the Grenadines | 0.0 /100 | #302 | Tragic 2.8% |
| Immigrants | Belize | 0.0 /100 | #303 | Tragic 2.8% |
| Cree | 0.0 /100 | #304 | Tragic 2.8% |
| Immigrants | West Indies | 0.0 /100 | #305 | Tragic 2.8% |
| Aleuts | 0.0 /100 | #306 | Tragic 2.8% |
| Natives/Alaskans | 0.0 /100 | #307 | Tragic 2.8% |
| Immigrants | Grenada | 0.0 /100 | #308 | Tragic 2.8% |
| Bangladeshis | 0.0 /100 | #309 | Tragic 2.8% |
| British West Indians | 0.0 /100 | #310 | Tragic 2.8% |
Demographics Similar to Immigrants from Uzbekistan by Self-Care Disability
In terms of self-care disability, the demographic groups most similar to Immigrants from Uzbekistan are Cherokee (2.9%, a difference of 0.53%), Seminole (2.9%, a difference of 0.63%), Comanche (2.9%, a difference of 0.75%), Paiute (2.9%, a difference of 0.94%), and Black/African American (2.9%, a difference of 1.0%).
| Demographics | Rating | Rank | Self-Care Disability |
| Assyrians/Chaldeans/Syriacs | 0.0 /100 | #318 | Tragic 2.8% |
| Spanish American Indians | 0.0 /100 | #319 | Tragic 2.9% |
| Chickasaw | 0.0 /100 | #320 | Tragic 2.9% |
| Navajo | 0.0 /100 | #321 | Tragic 2.9% |
| Comanche | 0.0 /100 | #322 | Tragic 2.9% |
| Seminole | 0.0 /100 | #323 | Tragic 2.9% |
| Cherokee | 0.0 /100 | #324 | Tragic 2.9% |
| Immigrants | Uzbekistan | 0.0 /100 | #325 | Tragic 2.9% |
| Paiute | 0.0 /100 | #326 | Tragic 2.9% |
| Blacks/African Americans | 0.0 /100 | #327 | Tragic 2.9% |
| Hopi | 0.0 /100 | #328 | Tragic 2.9% |
| Cajuns | 0.0 /100 | #329 | Tragic 2.9% |
| Nepalese | 0.0 /100 | #330 | Tragic 3.0% |
| Lumbee | 0.0 /100 | #331 | Tragic 3.0% |
| Kiowa | 0.0 /100 | #332 | Tragic 3.0% |