Immigrants from Belarus vs Immigrants from Syria Female Disability
COMPARE
Immigrants from Belarus
Immigrants from Syria
Female Disability
Female Disability Comparison
Immigrants from Belarus
Immigrants from Syria
11.8%
FEMALE DISABILITY
97.8/ 100
METRIC RATING
113th/ 347
METRIC RANK
11.9%
FEMALE DISABILITY
94.6/ 100
METRIC RATING
132nd/ 347
METRIC RANK
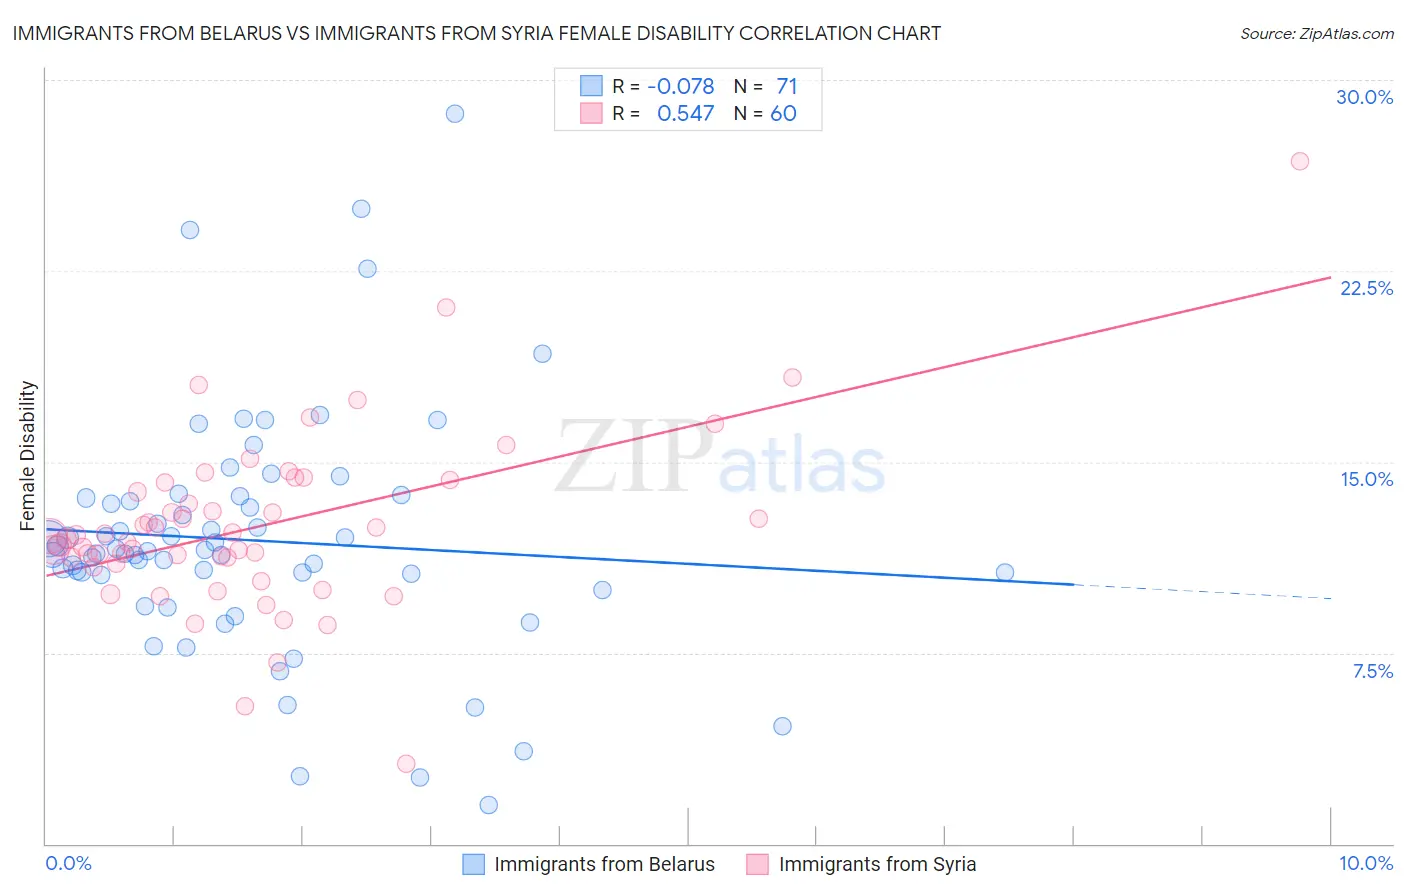
Immigrants from Belarus vs Immigrants from Syria Female Disability Correlation Chart
The statistical analysis conducted on geographies consisting of 150,193,098 people shows a slight negative correlation between the proportion of Immigrants from Belarus and percentage of females with a disability in the United States with a correlation coefficient (R) of -0.078 and weighted average of 11.8%. Similarly, the statistical analysis conducted on geographies consisting of 174,112,013 people shows a substantial positive correlation between the proportion of Immigrants from Syria and percentage of females with a disability in the United States with a correlation coefficient (R) of 0.547 and weighted average of 11.9%, a difference of 0.90%.
Female Disability Correlation Summary
| Measurement | Immigrants from Belarus | Immigrants from Syria |
| Minimum | 1.5% | 3.1% |
| Maximum | 28.7% | 26.8% |
| Range | 27.2% | 23.7% |
| Mean | 11.9% | 12.5% |
| Median | 11.5% | 12.0% |
| Interquartile 25% (IQ1) | 10.6% | 11.1% |
| Interquartile 75% (IQ3) | 13.6% | 14.0% |
| Interquartile Range (IQR) | 3.0% | 2.9% |
| Standard Deviation (Sample) | 4.7% | 3.5% |
| Standard Deviation (Population) | 4.7% | 3.5% |
Demographics Similar to Immigrants from Belarus and Immigrants from Syria by Female Disability
In terms of female disability, the demographic groups most similar to Immigrants from Belarus are Immigrants from Bangladesh (11.8%, a difference of 0.010%), South African (11.8%, a difference of 0.030%), Brazilian (11.8%, a difference of 0.030%), Immigrants from Morocco (11.8%, a difference of 0.070%), and Immigrants from Eastern Europe (11.8%, a difference of 0.23%). Similarly, the demographic groups most similar to Immigrants from Syria are Arab (11.9%, a difference of 0.10%), Nicaraguan (11.9%, a difference of 0.12%), Macedonian (11.8%, a difference of 0.19%), Immigrants from Latvia (11.8%, a difference of 0.21%), and South American Indian (11.8%, a difference of 0.25%).
| Demographics | Rating | Rank | Female Disability |
| Immigrants | Bangladesh | 97.8 /100 | #112 | Exceptional 11.8% |
| Immigrants | Belarus | 97.8 /100 | #113 | Exceptional 11.8% |
| South Africans | 97.7 /100 | #114 | Exceptional 11.8% |
| Brazilians | 97.7 /100 | #115 | Exceptional 11.8% |
| Immigrants | Morocco | 97.6 /100 | #116 | Exceptional 11.8% |
| Immigrants | Eastern Europe | 97.2 /100 | #117 | Exceptional 11.8% |
| Immigrants | Nigeria | 97.2 /100 | #118 | Exceptional 11.8% |
| Immigrants | Uganda | 97.2 /100 | #119 | Exceptional 11.8% |
| Immigrants | Kazakhstan | 97.0 /100 | #120 | Exceptional 11.8% |
| Immigrants | Netherlands | 96.9 /100 | #121 | Exceptional 11.8% |
| Immigrants | North Macedonia | 96.8 /100 | #122 | Exceptional 11.8% |
| Immigrants | Croatia | 96.7 /100 | #123 | Exceptional 11.8% |
| Russians | 96.5 /100 | #124 | Exceptional 11.8% |
| Immigrants | Italy | 96.4 /100 | #125 | Exceptional 11.8% |
| Immigrants | Europe | 96.2 /100 | #126 | Exceptional 11.8% |
| South American Indians | 95.8 /100 | #127 | Exceptional 11.8% |
| Immigrants | Latvia | 95.6 /100 | #128 | Exceptional 11.8% |
| Macedonians | 95.5 /100 | #129 | Exceptional 11.8% |
| Nicaraguans | 95.2 /100 | #130 | Exceptional 11.9% |
| Arabs | 95.1 /100 | #131 | Exceptional 11.9% |
| Immigrants | Syria | 94.6 /100 | #132 | Exceptional 11.9% |