Immigrants from Bangladesh vs Paraguayan Male Disability
COMPARE
Immigrants from Bangladesh
Paraguayan
Male Disability
Male Disability Comparison
Immigrants from Bangladesh
Paraguayans
10.3%
MALE DISABILITY
99.7/ 100
METRIC RATING
43rd/ 347
METRIC RANK
10.1%
MALE DISABILITY
99.9/ 100
METRIC RATING
26th/ 347
METRIC RANK
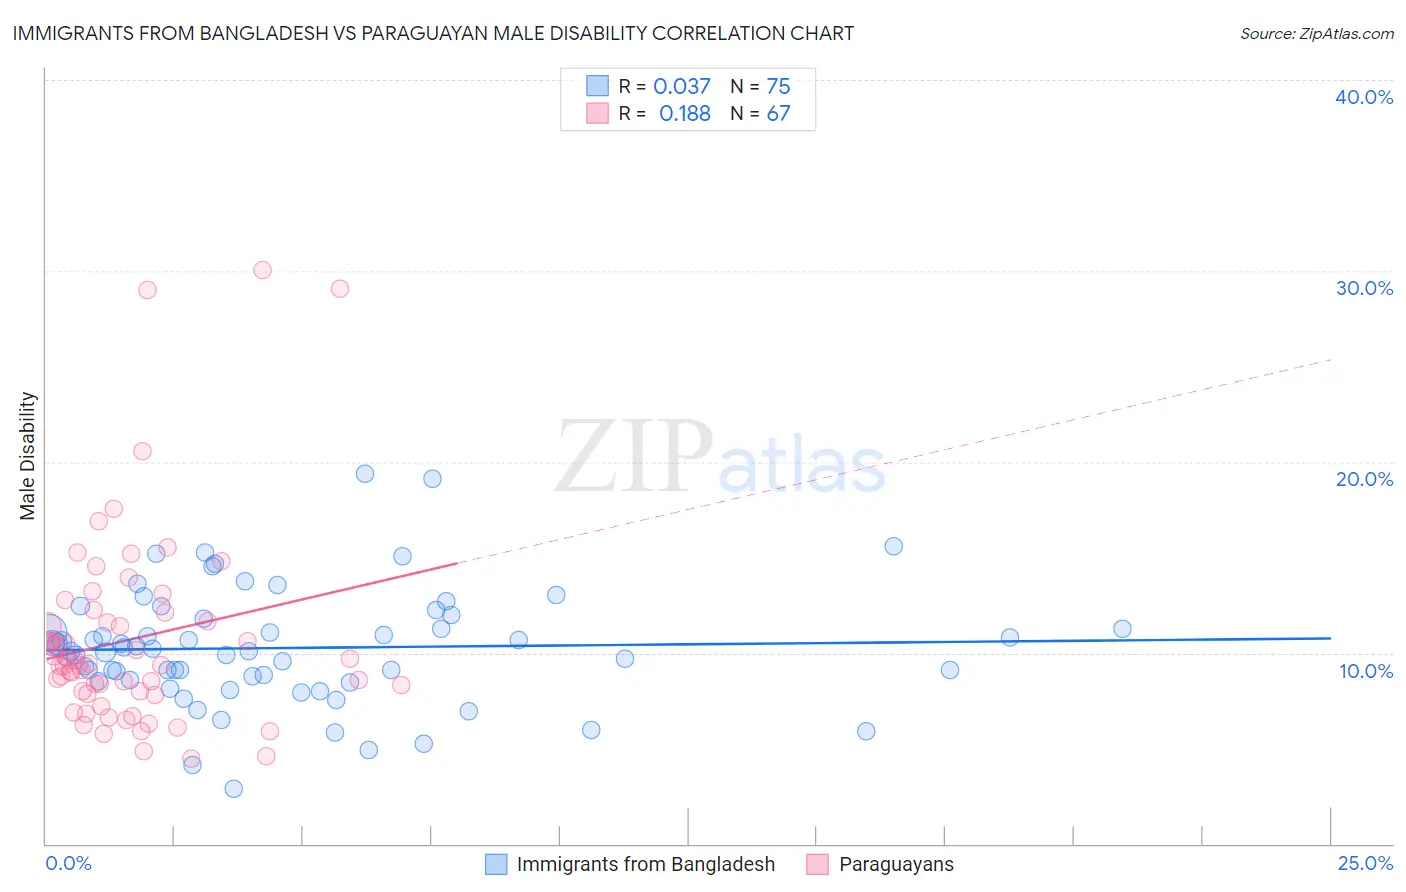
Immigrants from Bangladesh vs Paraguayan Male Disability Correlation Chart
The statistical analysis conducted on geographies consisting of 203,673,842 people shows no correlation between the proportion of Immigrants from Bangladesh and percentage of males with a disability in the United States with a correlation coefficient (R) of 0.037 and weighted average of 10.3%. Similarly, the statistical analysis conducted on geographies consisting of 95,111,700 people shows a poor positive correlation between the proportion of Paraguayans and percentage of males with a disability in the United States with a correlation coefficient (R) of 0.188 and weighted average of 10.1%, a difference of 2.4%.
Male Disability Correlation Summary
| Measurement | Immigrants from Bangladesh | Paraguayan |
| Minimum | 2.9% | 4.4% |
| Maximum | 19.4% | 30.1% |
| Range | 16.5% | 25.6% |
| Mean | 10.3% | 10.7% |
| Median | 10.1% | 9.4% |
| Interquartile 25% (IQ1) | 8.6% | 7.9% |
| Interquartile 75% (IQ3) | 11.8% | 12.1% |
| Interquartile Range (IQR) | 3.2% | 4.2% |
| Standard Deviation (Sample) | 3.0% | 5.2% |
| Standard Deviation (Population) | 3.0% | 5.2% |
Demographics Similar to Immigrants from Bangladesh and Paraguayans by Male Disability
In terms of male disability, the demographic groups most similar to Immigrants from Bangladesh are Mongolian (10.3%, a difference of 0.020%), Immigrants from El Salvador (10.3%, a difference of 0.070%), Immigrants from Nepal (10.3%, a difference of 0.27%), Taiwanese (10.3%, a difference of 0.27%), and Afghan (10.2%, a difference of 0.47%). Similarly, the demographic groups most similar to Paraguayans are Immigrants from Malaysia (10.0%, a difference of 0.13%), Immigrants from Asia (10.0%, a difference of 0.32%), Egyptian (10.1%, a difference of 0.32%), Vietnamese (10.1%, a difference of 0.34%), and Venezuelan (10.1%, a difference of 0.49%).
| Demographics | Rating | Rank | Male Disability |
| Immigrants | Asia | 100.0 /100 | #24 | Exceptional 10.0% |
| Immigrants | Malaysia | 99.9 /100 | #25 | Exceptional 10.0% |
| Paraguayans | 99.9 /100 | #26 | Exceptional 10.1% |
| Egyptians | 99.9 /100 | #27 | Exceptional 10.1% |
| Vietnamese | 99.9 /100 | #28 | Exceptional 10.1% |
| Venezuelans | 99.9 /100 | #29 | Exceptional 10.1% |
| Immigrants | Egypt | 99.9 /100 | #30 | Exceptional 10.1% |
| Soviet Union | 99.9 /100 | #31 | Exceptional 10.1% |
| Argentineans | 99.9 /100 | #32 | Exceptional 10.1% |
| Immigrants | Ethiopia | 99.9 /100 | #33 | Exceptional 10.2% |
| Immigrants | Turkey | 99.9 /100 | #34 | Exceptional 10.2% |
| Immigrants | Argentina | 99.9 /100 | #35 | Exceptional 10.2% |
| Ethiopians | 99.8 /100 | #36 | Exceptional 10.2% |
| Immigrants | Indonesia | 99.8 /100 | #37 | Exceptional 10.2% |
| Immigrants | Kuwait | 99.8 /100 | #38 | Exceptional 10.2% |
| Afghans | 99.8 /100 | #39 | Exceptional 10.2% |
| Immigrants | Nepal | 99.8 /100 | #40 | Exceptional 10.3% |
| Taiwanese | 99.8 /100 | #41 | Exceptional 10.3% |
| Mongolians | 99.7 /100 | #42 | Exceptional 10.3% |
| Immigrants | Bangladesh | 99.7 /100 | #43 | Exceptional 10.3% |
| Immigrants | El Salvador | 99.7 /100 | #44 | Exceptional 10.3% |