Immigrants from Albania vs Romanian Male Disability
COMPARE
Immigrants from Albania
Romanian
Male Disability
Male Disability Comparison
Immigrants from Albania
Romanians
11.0%
MALE DISABILITY
74.4/ 100
METRIC RATING
152nd/ 347
METRIC RANK
11.2%
MALE DISABILITY
50.7/ 100
METRIC RATING
172nd/ 347
METRIC RANK
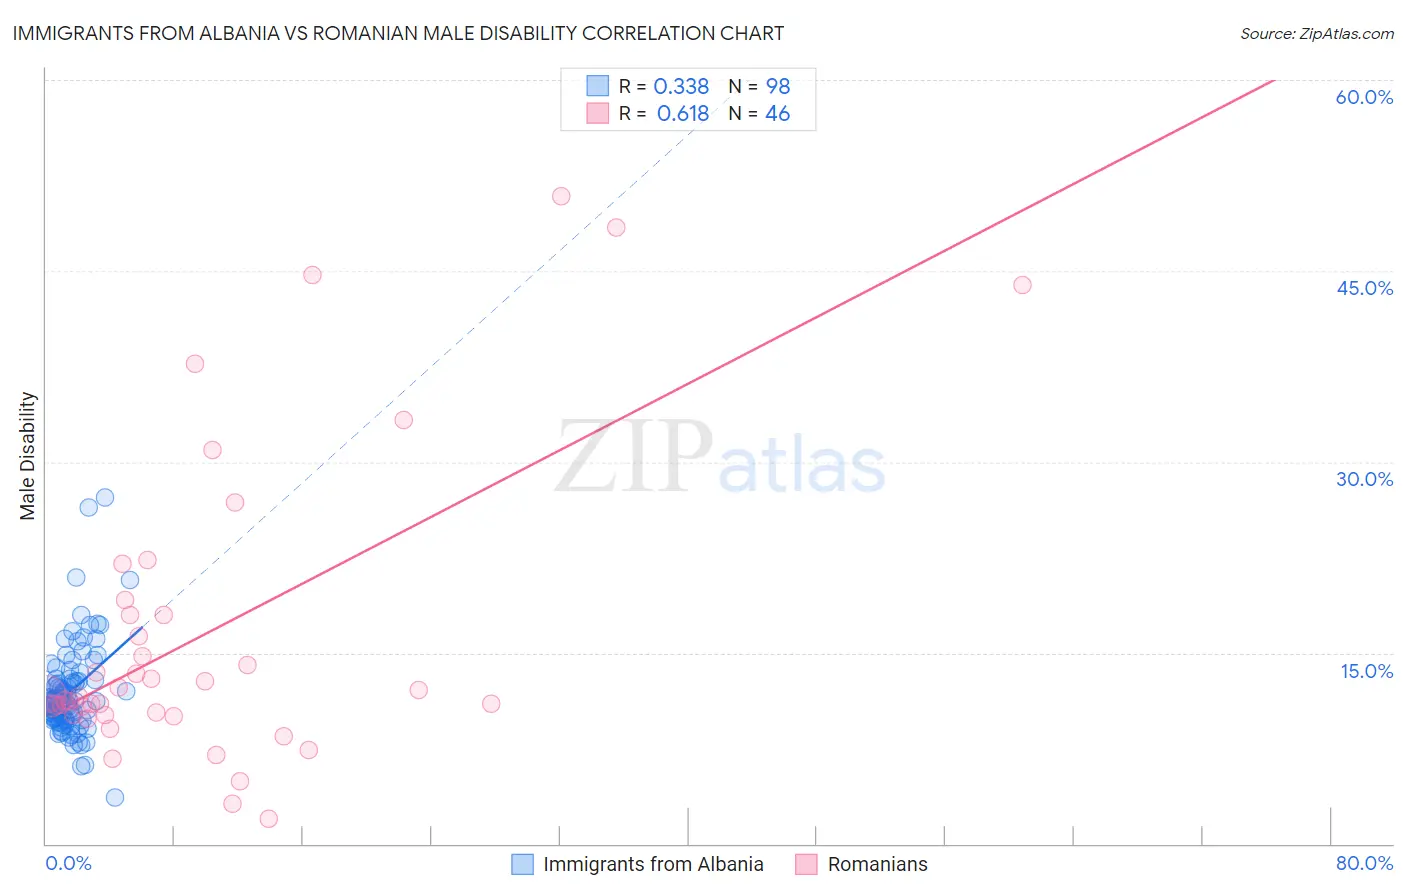
Immigrants from Albania vs Romanian Male Disability Correlation Chart
The statistical analysis conducted on geographies consisting of 119,394,562 people shows a mild positive correlation between the proportion of Immigrants from Albania and percentage of males with a disability in the United States with a correlation coefficient (R) of 0.338 and weighted average of 11.0%. Similarly, the statistical analysis conducted on geographies consisting of 377,848,419 people shows a significant positive correlation between the proportion of Romanians and percentage of males with a disability in the United States with a correlation coefficient (R) of 0.618 and weighted average of 11.2%, a difference of 1.5%.
Male Disability Correlation Summary
| Measurement | Immigrants from Albania | Romanian |
| Minimum | 3.6% | 2.0% |
| Maximum | 27.2% | 50.8% |
| Range | 23.6% | 48.8% |
| Mean | 11.9% | 16.5% |
| Median | 11.2% | 11.7% |
| Interquartile 25% (IQ1) | 9.8% | 10.2% |
| Interquartile 75% (IQ3) | 12.8% | 18.0% |
| Interquartile Range (IQR) | 3.0% | 7.8% |
| Standard Deviation (Sample) | 3.6% | 11.9% |
| Standard Deviation (Population) | 3.6% | 11.8% |
Demographics Similar to Immigrants from Albania and Romanians by Male Disability
In terms of male disability, the demographic groups most similar to Immigrants from Albania are Immigrants from Northern Europe (11.1%, a difference of 0.090%), Immigrants from Moldova (11.1%, a difference of 0.11%), Immigrants from Middle Africa (11.1%, a difference of 0.25%), Russian (11.1%, a difference of 0.32%), and Immigrants from Western Africa (11.1%, a difference of 0.36%). Similarly, the demographic groups most similar to Romanians are Haitian (11.2%, a difference of 0.10%), New Zealander (11.2%, a difference of 0.12%), Barbadian (11.2%, a difference of 0.15%), Immigrants from Latin America (11.2%, a difference of 0.18%), and Immigrants from Southern Europe (11.2%, a difference of 0.20%).
| Demographics | Rating | Rank | Male Disability |
| Immigrants | Albania | 74.4 /100 | #152 | Good 11.0% |
| Immigrants | Northern Europe | 73.2 /100 | #153 | Good 11.1% |
| Immigrants | Moldova | 72.8 /100 | #154 | Good 11.1% |
| Immigrants | Middle Africa | 70.9 /100 | #155 | Good 11.1% |
| Russians | 69.8 /100 | #156 | Good 11.1% |
| Immigrants | Western Africa | 69.2 /100 | #157 | Good 11.1% |
| Latvians | 68.1 /100 | #158 | Good 11.1% |
| Guatemalans | 67.2 /100 | #159 | Good 11.1% |
| Albanians | 66.5 /100 | #160 | Good 11.1% |
| Immigrants | West Indies | 65.7 /100 | #161 | Good 11.1% |
| Immigrants | Haiti | 65.3 /100 | #162 | Good 11.1% |
| Immigrants | Kenya | 63.8 /100 | #163 | Good 11.1% |
| British West Indians | 62.8 /100 | #164 | Good 11.1% |
| Luxembourgers | 61.9 /100 | #165 | Good 11.1% |
| Immigrants | Hungary | 61.2 /100 | #166 | Good 11.1% |
| Immigrants | Southern Europe | 54.4 /100 | #167 | Average 11.2% |
| Immigrants | Latin America | 54.0 /100 | #168 | Average 11.2% |
| Barbadians | 53.4 /100 | #169 | Average 11.2% |
| New Zealanders | 52.9 /100 | #170 | Average 11.2% |
| Haitians | 52.5 /100 | #171 | Average 11.2% |
| Romanians | 50.7 /100 | #172 | Average 11.2% |