Carpatho Rusyn vs Romanian Male Disability
COMPARE
Carpatho Rusyn
Romanian
Male Disability
Male Disability Comparison
Carpatho Rusyns
Romanians
11.9%
MALE DISABILITY
1.3/ 100
METRIC RATING
237th/ 347
METRIC RANK
11.2%
MALE DISABILITY
50.7/ 100
METRIC RATING
172nd/ 347
METRIC RANK
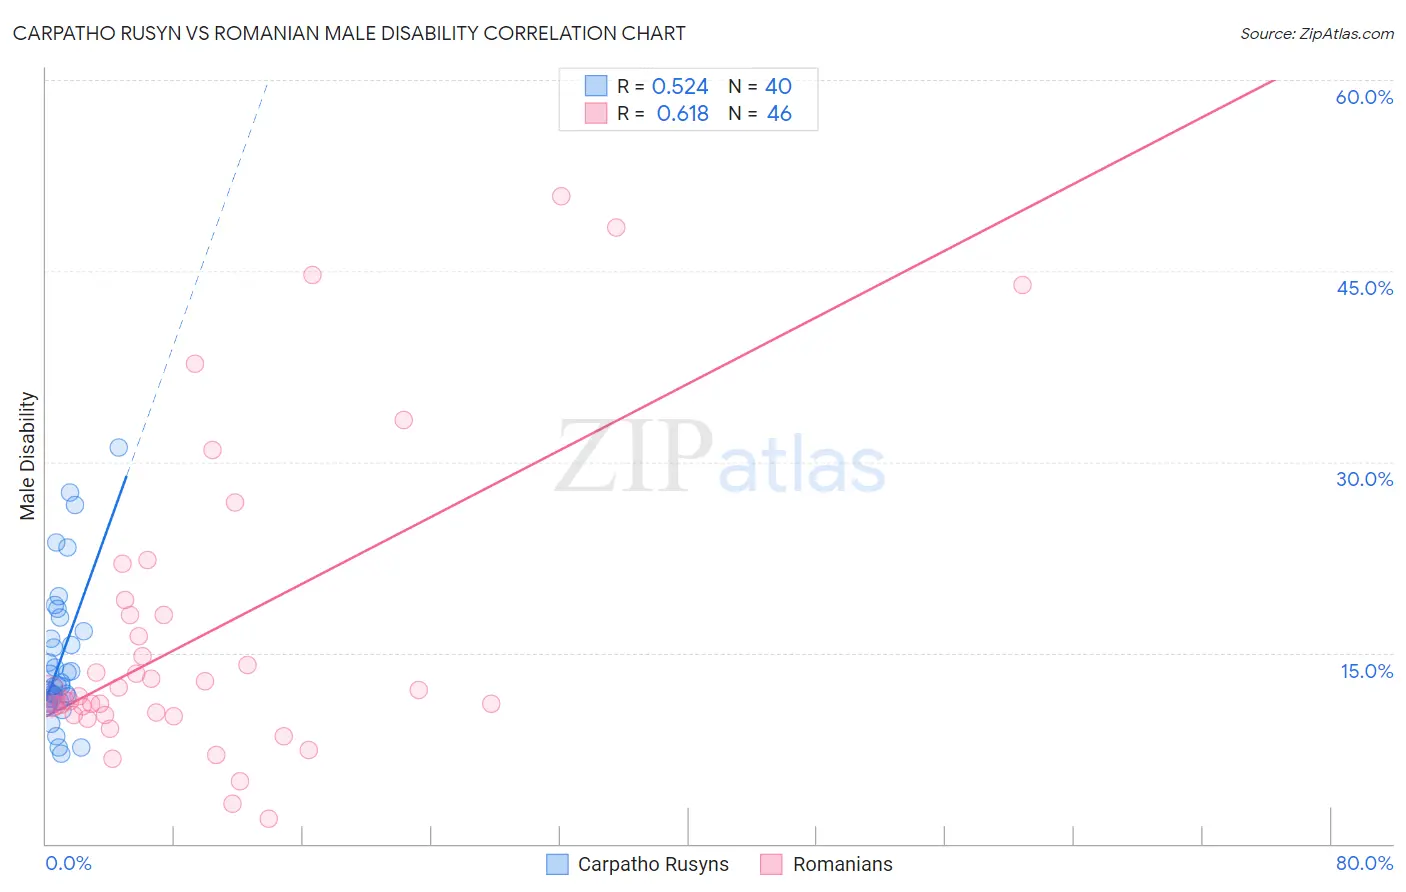
Carpatho Rusyn vs Romanian Male Disability Correlation Chart
The statistical analysis conducted on geographies consisting of 58,870,293 people shows a substantial positive correlation between the proportion of Carpatho Rusyns and percentage of males with a disability in the United States with a correlation coefficient (R) of 0.524 and weighted average of 11.9%. Similarly, the statistical analysis conducted on geographies consisting of 377,848,419 people shows a significant positive correlation between the proportion of Romanians and percentage of males with a disability in the United States with a correlation coefficient (R) of 0.618 and weighted average of 11.2%, a difference of 6.0%.
Male Disability Correlation Summary
| Measurement | Carpatho Rusyn | Romanian |
| Minimum | 7.0% | 2.0% |
| Maximum | 31.1% | 50.8% |
| Range | 24.1% | 48.8% |
| Mean | 14.4% | 16.5% |
| Median | 12.4% | 11.7% |
| Interquartile 25% (IQ1) | 11.3% | 10.2% |
| Interquartile 75% (IQ3) | 16.4% | 18.0% |
| Interquartile Range (IQR) | 5.1% | 7.8% |
| Standard Deviation (Sample) | 5.5% | 11.9% |
| Standard Deviation (Population) | 5.5% | 11.8% |
Similar Demographics by Male Disability
Demographics Similar to Carpatho Rusyns by Male Disability
In terms of male disability, the demographic groups most similar to Carpatho Rusyns are U.S. Virgin Islander (11.9%, a difference of 0.010%), Yugoslavian (11.9%, a difference of 0.10%), Immigrants from North America (11.9%, a difference of 0.15%), Italian (11.9%, a difference of 0.15%), and Czech (11.9%, a difference of 0.20%).
| Demographics | Rating | Rank | Male Disability |
| Croatians | 2.1 /100 | #230 | Tragic 11.8% |
| Dominicans | 1.8 /100 | #231 | Tragic 11.8% |
| Malaysians | 1.8 /100 | #232 | Tragic 11.8% |
| Mexicans | 1.7 /100 | #233 | Tragic 11.8% |
| Immigrants | Canada | 1.6 /100 | #234 | Tragic 11.9% |
| Immigrants | North America | 1.5 /100 | #235 | Tragic 11.9% |
| U.S. Virgin Islanders | 1.3 /100 | #236 | Tragic 11.9% |
| Carpatho Rusyns | 1.3 /100 | #237 | Tragic 11.9% |
| Yugoslavians | 1.2 /100 | #238 | Tragic 11.9% |
| Italians | 1.2 /100 | #239 | Tragic 11.9% |
| Czechs | 1.1 /100 | #240 | Tragic 11.9% |
| Bahamians | 1.1 /100 | #241 | Tragic 11.9% |
| Northern Europeans | 1.1 /100 | #242 | Tragic 11.9% |
| Samoans | 1.1 /100 | #243 | Tragic 11.9% |
| Immigrants | Laos | 1.0 /100 | #244 | Tragic 11.9% |
Demographics Similar to Romanians by Male Disability
In terms of male disability, the demographic groups most similar to Romanians are Immigrants from Burma/Myanmar (11.2%, a difference of 0.020%), Maltese (11.2%, a difference of 0.040%), Haitian (11.2%, a difference of 0.10%), New Zealander (11.2%, a difference of 0.12%), and Immigrants from Honduras (11.2%, a difference of 0.12%).
| Demographics | Rating | Rank | Male Disability |
| Luxembourgers | 61.9 /100 | #165 | Good 11.1% |
| Immigrants | Hungary | 61.2 /100 | #166 | Good 11.1% |
| Immigrants | Southern Europe | 54.4 /100 | #167 | Average 11.2% |
| Immigrants | Latin America | 54.0 /100 | #168 | Average 11.2% |
| Barbadians | 53.4 /100 | #169 | Average 11.2% |
| New Zealanders | 52.9 /100 | #170 | Average 11.2% |
| Haitians | 52.5 /100 | #171 | Average 11.2% |
| Romanians | 50.7 /100 | #172 | Average 11.2% |
| Immigrants | Burma/Myanmar | 50.4 /100 | #173 | Average 11.2% |
| Maltese | 50.0 /100 | #174 | Average 11.2% |
| Immigrants | Honduras | 48.7 /100 | #175 | Average 11.2% |
| Syrians | 46.6 /100 | #176 | Average 11.2% |
| Immigrants | Norway | 44.2 /100 | #177 | Average 11.3% |
| Australians | 42.2 /100 | #178 | Average 11.3% |
| Immigrants | Caribbean | 41.4 /100 | #179 | Average 11.3% |