Immigrants from Bahamas vs Jordanian Unemployment Among Ages 45 to 54 years
COMPARE
Immigrants from Bahamas
Jordanian
Unemployment Among Ages 45 to 54 years
Unemployment Among Ages 45 to 54 years Comparison
Immigrants from Bahamas
Jordanians
4.8%
UNEMPLOYMENT AMONG AGES 45 TO 54 YEARS
0.3/ 100
METRIC RATING
252nd/ 347
METRIC RANK
4.2%
UNEMPLOYMENT AMONG AGES 45 TO 54 YEARS
99.8/ 100
METRIC RATING
39th/ 347
METRIC RANK
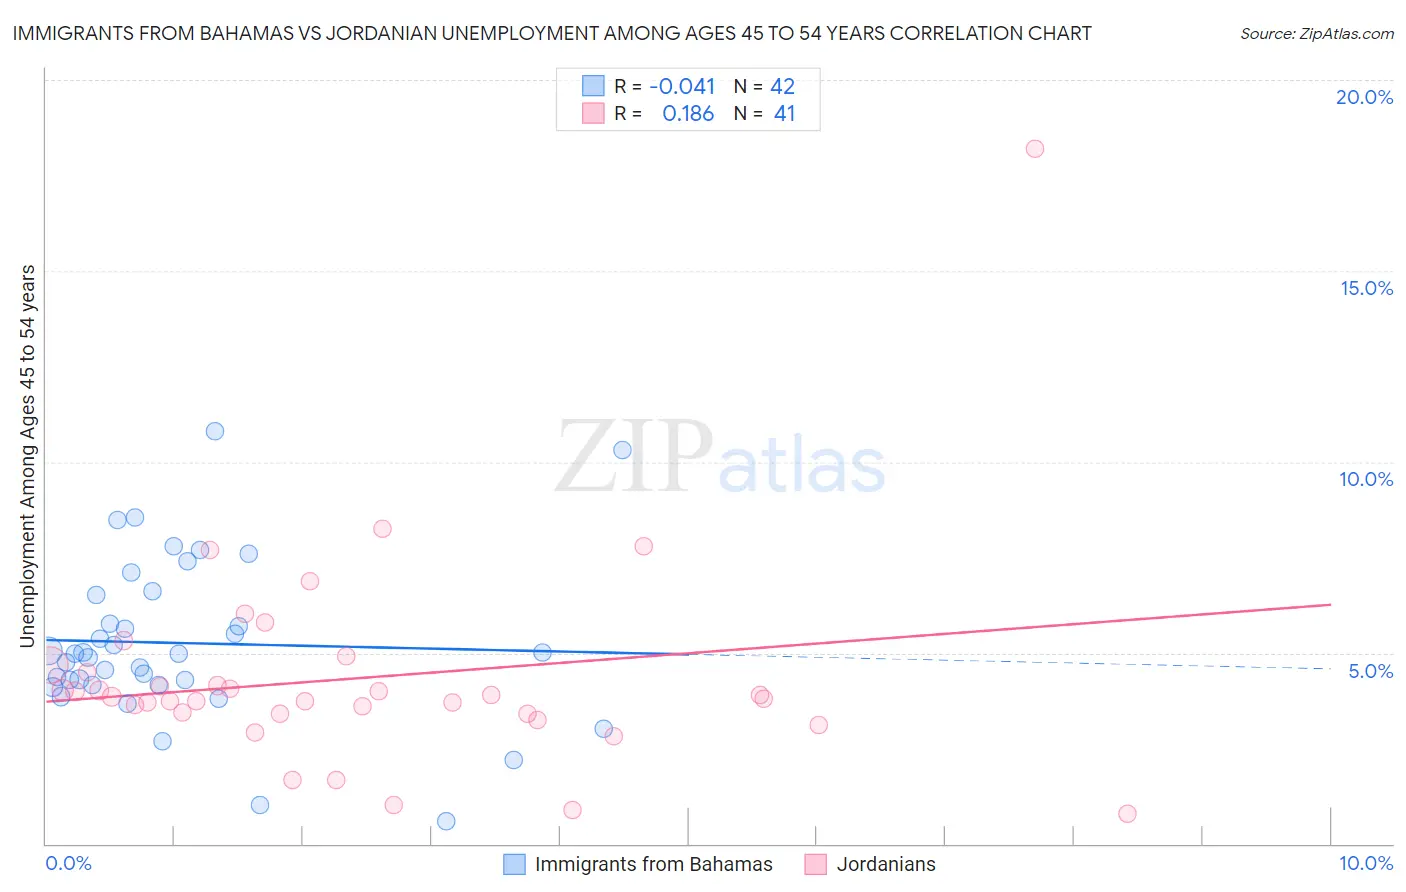
Immigrants from Bahamas vs Jordanian Unemployment Among Ages 45 to 54 years Correlation Chart
The statistical analysis conducted on geographies consisting of 103,881,335 people shows no correlation between the proportion of Immigrants from Bahamas and unemployment rate among population between the ages 45 and 54 in the United States with a correlation coefficient (R) of -0.041 and weighted average of 4.8%. Similarly, the statistical analysis conducted on geographies consisting of 165,217,301 people shows a poor positive correlation between the proportion of Jordanians and unemployment rate among population between the ages 45 and 54 in the United States with a correlation coefficient (R) of 0.186 and weighted average of 4.2%, a difference of 14.9%.
Unemployment Among Ages 45 to 54 years Correlation Summary
| Measurement | Immigrants from Bahamas | Jordanian |
| Minimum | 0.60% | 0.80% |
| Maximum | 10.8% | 18.2% |
| Range | 10.2% | 17.4% |
| Mean | 5.3% | 4.3% |
| Median | 5.0% | 3.8% |
| Interquartile 25% (IQ1) | 4.2% | 3.4% |
| Interquartile 75% (IQ3) | 6.5% | 4.6% |
| Interquartile Range (IQR) | 2.4% | 1.2% |
| Standard Deviation (Sample) | 2.1% | 2.8% |
| Standard Deviation (Population) | 2.1% | 2.7% |
Similar Demographics by Unemployment Among Ages 45 to 54 years
Demographics Similar to Immigrants from Bahamas by Unemployment Among Ages 45 to 54 years
In terms of unemployment among ages 45 to 54 years, the demographic groups most similar to Immigrants from Bahamas are Moroccan (4.8%, a difference of 0.17%), Honduran (4.8%, a difference of 0.24%), Immigrants from Lebanon (4.8%, a difference of 0.39%), Immigrants from El Salvador (4.8%, a difference of 0.52%), and Immigrants from Western Asia (4.8%, a difference of 0.60%).
| Demographics | Rating | Rank | Unemployment Among Ages 45 to 54 years |
| Immigrants | Albania | 0.9 /100 | #245 | Tragic 4.8% |
| Immigrants | Syria | 0.9 /100 | #246 | Tragic 4.8% |
| Israelis | 0.9 /100 | #247 | Tragic 4.8% |
| Immigrants | Liberia | 0.8 /100 | #248 | Tragic 4.8% |
| Immigrants | Honduras | 0.7 /100 | #249 | Tragic 4.8% |
| Salvadorans | 0.7 /100 | #250 | Tragic 4.8% |
| Hondurans | 0.4 /100 | #251 | Tragic 4.8% |
| Immigrants | Bahamas | 0.3 /100 | #252 | Tragic 4.8% |
| Moroccans | 0.3 /100 | #253 | Tragic 4.8% |
| Immigrants | Lebanon | 0.2 /100 | #254 | Tragic 4.8% |
| Immigrants | El Salvador | 0.2 /100 | #255 | Tragic 4.8% |
| Immigrants | Western Asia | 0.2 /100 | #256 | Tragic 4.8% |
| Immigrants | Western Africa | 0.2 /100 | #257 | Tragic 4.9% |
| Sub-Saharan Africans | 0.2 /100 | #258 | Tragic 4.9% |
| Ugandans | 0.1 /100 | #259 | Tragic 4.9% |
Demographics Similar to Jordanians by Unemployment Among Ages 45 to 54 years
In terms of unemployment among ages 45 to 54 years, the demographic groups most similar to Jordanians are Scotch-Irish (4.2%, a difference of 0.15%), Osage (4.2%, a difference of 0.16%), Croatian (4.2%, a difference of 0.18%), Immigrants from Taiwan (4.2%, a difference of 0.19%), and Northern European (4.2%, a difference of 0.20%).
| Demographics | Rating | Rank | Unemployment Among Ages 45 to 54 years |
| Slovenes | 99.9 /100 | #32 | Exceptional 4.2% |
| Immigrants | South Central Asia | 99.9 /100 | #33 | Exceptional 4.2% |
| Dutch | 99.9 /100 | #34 | Exceptional 4.2% |
| Immigrants | Taiwan | 99.8 /100 | #35 | Exceptional 4.2% |
| Croatians | 99.8 /100 | #36 | Exceptional 4.2% |
| Osage | 99.8 /100 | #37 | Exceptional 4.2% |
| Scotch-Irish | 99.8 /100 | #38 | Exceptional 4.2% |
| Jordanians | 99.8 /100 | #39 | Exceptional 4.2% |
| Northern Europeans | 99.8 /100 | #40 | Exceptional 4.2% |
| Czechoslovakians | 99.8 /100 | #41 | Exceptional 4.2% |
| Immigrants | Scotland | 99.8 /100 | #42 | Exceptional 4.2% |
| Zimbabweans | 99.8 /100 | #43 | Exceptional 4.2% |
| Immigrants | Singapore | 99.7 /100 | #44 | Exceptional 4.2% |
| Immigrants | Bulgaria | 99.7 /100 | #45 | Exceptional 4.2% |
| Luxembourgers | 99.6 /100 | #46 | Exceptional 4.2% |