Immigrants from Bahamas vs Italian Cognitive Disability
COMPARE
Immigrants from Bahamas
Italian
Cognitive Disability
Cognitive Disability Comparison
Immigrants from Bahamas
Italians
18.0%
COGNITIVE DISABILITY
0.3/ 100
METRIC RATING
270th/ 347
METRIC RANK
16.4%
COGNITIVE DISABILITY
99.9/ 100
METRIC RATING
33rd/ 347
METRIC RANK
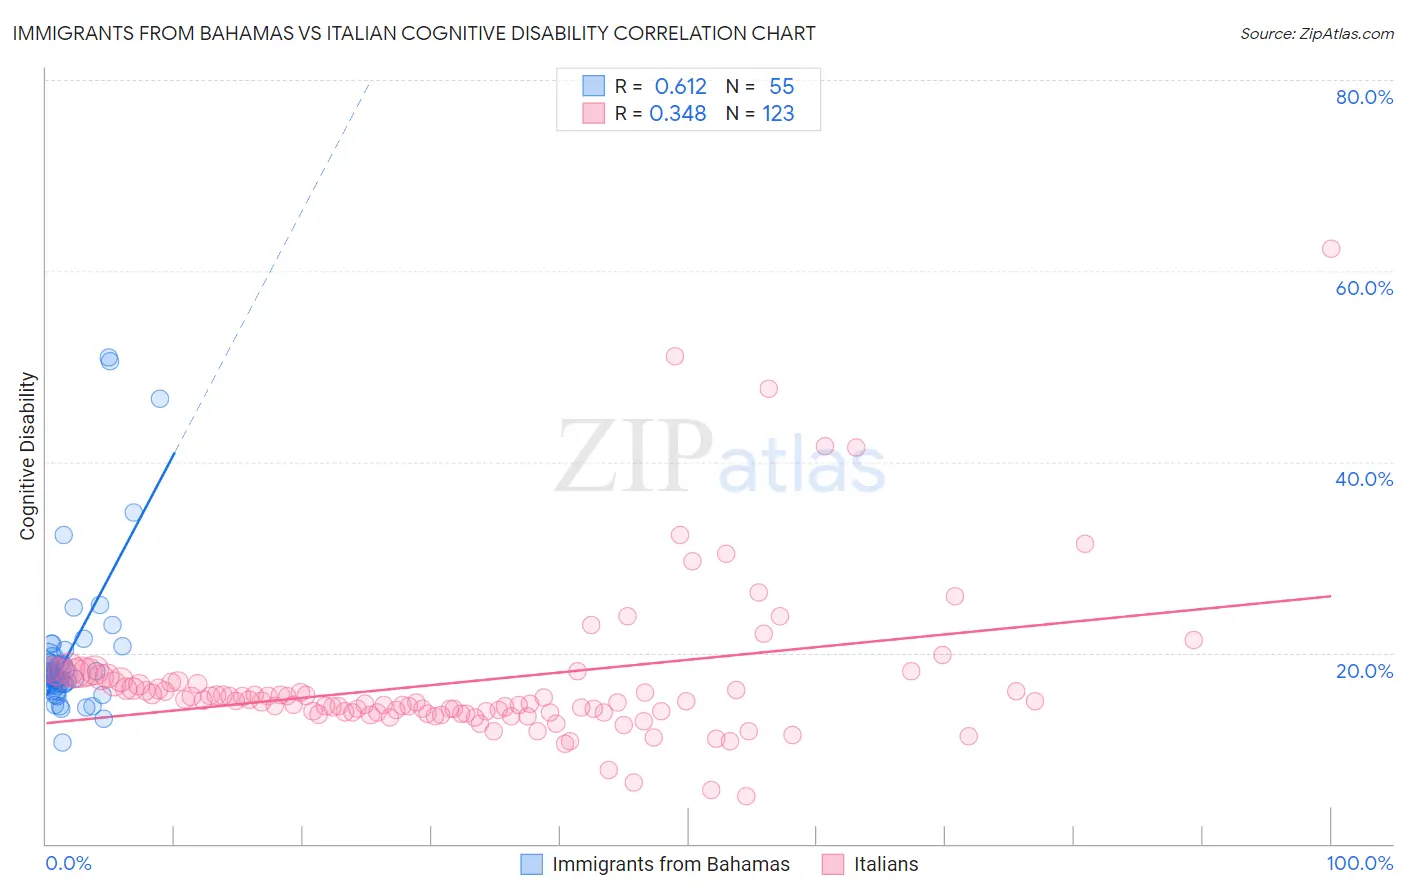
Immigrants from Bahamas vs Italian Cognitive Disability Correlation Chart
The statistical analysis conducted on geographies consisting of 104,656,442 people shows a significant positive correlation between the proportion of Immigrants from Bahamas and percentage of population with cognitive disability in the United States with a correlation coefficient (R) of 0.612 and weighted average of 18.0%. Similarly, the statistical analysis conducted on geographies consisting of 574,911,788 people shows a mild positive correlation between the proportion of Italians and percentage of population with cognitive disability in the United States with a correlation coefficient (R) of 0.348 and weighted average of 16.4%, a difference of 9.7%.
Cognitive Disability Correlation Summary
| Measurement | Immigrants from Bahamas | Italian |
| Minimum | 10.6% | 4.9% |
| Maximum | 51.0% | 62.3% |
| Range | 40.4% | 57.4% |
| Mean | 20.0% | 16.9% |
| Median | 17.6% | 15.0% |
| Interquartile 25% (IQ1) | 16.5% | 13.7% |
| Interquartile 75% (IQ3) | 19.6% | 17.1% |
| Interquartile Range (IQR) | 3.1% | 3.3% |
| Standard Deviation (Sample) | 8.2% | 8.0% |
| Standard Deviation (Population) | 8.1% | 8.0% |
Similar Demographics by Cognitive Disability
Demographics Similar to Immigrants from Bahamas by Cognitive Disability
In terms of cognitive disability, the demographic groups most similar to Immigrants from Bahamas are Honduran (18.0%, a difference of 0.010%), Potawatomi (18.0%, a difference of 0.070%), Immigrants from Honduras (18.0%, a difference of 0.090%), Cherokee (18.0%, a difference of 0.15%), and Nepalese (18.0%, a difference of 0.16%).
| Demographics | Rating | Rank | Cognitive Disability |
| Immigrants | Barbados | 0.4 /100 | #263 | Tragic 17.9% |
| Menominee | 0.4 /100 | #264 | Tragic 18.0% |
| Spanish Americans | 0.4 /100 | #265 | Tragic 18.0% |
| Belizeans | 0.4 /100 | #266 | Tragic 18.0% |
| Nepalese | 0.3 /100 | #267 | Tragic 18.0% |
| Cherokee | 0.3 /100 | #268 | Tragic 18.0% |
| Hondurans | 0.3 /100 | #269 | Tragic 18.0% |
| Immigrants | Bahamas | 0.3 /100 | #270 | Tragic 18.0% |
| Potawatomi | 0.2 /100 | #271 | Tragic 18.0% |
| Immigrants | Honduras | 0.2 /100 | #272 | Tragic 18.0% |
| Immigrants | Nepal | 0.2 /100 | #273 | Tragic 18.0% |
| Immigrants | Nigeria | 0.2 /100 | #274 | Tragic 18.0% |
| Immigrants | Laos | 0.2 /100 | #275 | Tragic 18.1% |
| Yuman | 0.2 /100 | #276 | Tragic 18.1% |
| Immigrants | Kuwait | 0.2 /100 | #277 | Tragic 18.1% |
Demographics Similar to Italians by Cognitive Disability
In terms of cognitive disability, the demographic groups most similar to Italians are Russian (16.4%, a difference of 0.0%), Immigrants from Israel (16.4%, a difference of 0.070%), Slovak (16.4%, a difference of 0.080%), Greek (16.4%, a difference of 0.090%), and Immigrants from Romania (16.4%, a difference of 0.13%).
| Demographics | Rating | Rank | Cognitive Disability |
| Immigrants | Croatia | 99.9 /100 | #26 | Exceptional 16.4% |
| Immigrants | Pakistan | 99.9 /100 | #27 | Exceptional 16.4% |
| Poles | 99.9 /100 | #28 | Exceptional 16.4% |
| Filipinos | 99.9 /100 | #29 | Exceptional 16.4% |
| Czechs | 99.9 /100 | #30 | Exceptional 16.4% |
| Immigrants | Romania | 99.9 /100 | #31 | Exceptional 16.4% |
| Immigrants | Israel | 99.9 /100 | #32 | Exceptional 16.4% |
| Italians | 99.9 /100 | #33 | Exceptional 16.4% |
| Russians | 99.9 /100 | #34 | Exceptional 16.4% |
| Slovaks | 99.9 /100 | #35 | Exceptional 16.4% |
| Greeks | 99.9 /100 | #36 | Exceptional 16.4% |
| Slovenes | 99.9 /100 | #37 | Exceptional 16.5% |
| Immigrants | Eastern Europe | 99.9 /100 | #38 | Exceptional 16.5% |
| Bolivians | 99.9 /100 | #39 | Exceptional 16.5% |
| Immigrants | Belarus | 99.9 /100 | #40 | Exceptional 16.5% |