Immigrants from Bahamas vs Immigrants from Bolivia Cognitive Disability
COMPARE
Immigrants from Bahamas
Immigrants from Bolivia
Cognitive Disability
Cognitive Disability Comparison
Immigrants from Bahamas
Immigrants from Bolivia
18.0%
COGNITIVE DISABILITY
0.3/ 100
METRIC RATING
270th/ 347
METRIC RANK
16.3%
COGNITIVE DISABILITY
100.0/ 100
METRIC RATING
19th/ 347
METRIC RANK
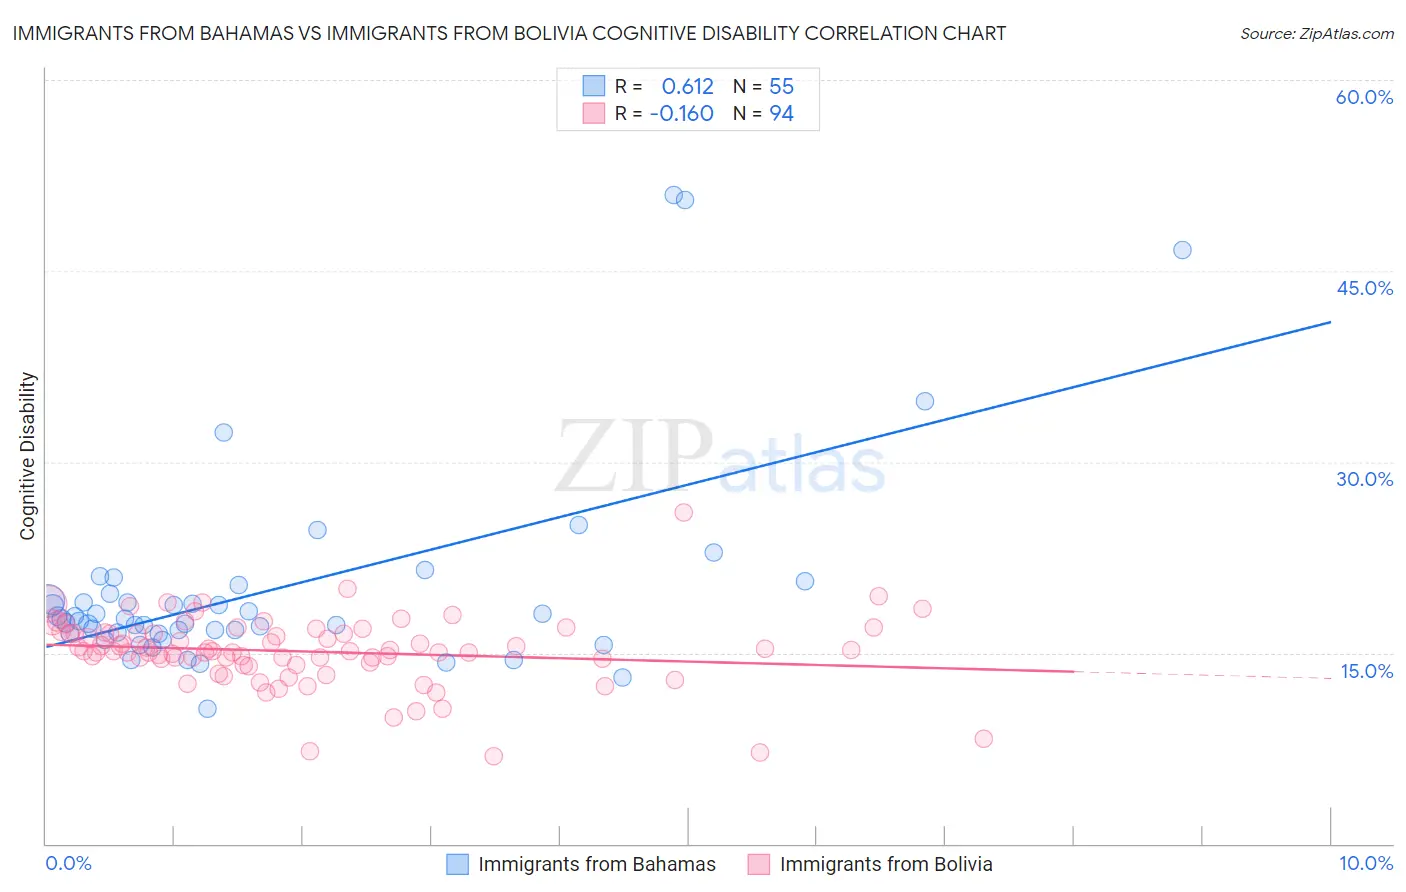
Immigrants from Bahamas vs Immigrants from Bolivia Cognitive Disability Correlation Chart
The statistical analysis conducted on geographies consisting of 104,656,442 people shows a significant positive correlation between the proportion of Immigrants from Bahamas and percentage of population with cognitive disability in the United States with a correlation coefficient (R) of 0.612 and weighted average of 18.0%. Similarly, the statistical analysis conducted on geographies consisting of 158,730,419 people shows a poor negative correlation between the proportion of Immigrants from Bolivia and percentage of population with cognitive disability in the United States with a correlation coefficient (R) of -0.160 and weighted average of 16.3%, a difference of 10.3%.
Cognitive Disability Correlation Summary
| Measurement | Immigrants from Bahamas | Immigrants from Bolivia |
| Minimum | 10.6% | 6.8% |
| Maximum | 51.0% | 26.0% |
| Range | 40.4% | 19.2% |
| Mean | 20.0% | 15.1% |
| Median | 17.6% | 15.1% |
| Interquartile 25% (IQ1) | 16.5% | 14.2% |
| Interquartile 75% (IQ3) | 19.6% | 16.5% |
| Interquartile Range (IQR) | 3.1% | 2.3% |
| Standard Deviation (Sample) | 8.2% | 2.8% |
| Standard Deviation (Population) | 8.1% | 2.8% |
Similar Demographics by Cognitive Disability
Demographics Similar to Immigrants from Bahamas by Cognitive Disability
In terms of cognitive disability, the demographic groups most similar to Immigrants from Bahamas are Honduran (18.0%, a difference of 0.010%), Potawatomi (18.0%, a difference of 0.070%), Immigrants from Honduras (18.0%, a difference of 0.090%), Cherokee (18.0%, a difference of 0.15%), and Nepalese (18.0%, a difference of 0.16%).
| Demographics | Rating | Rank | Cognitive Disability |
| Immigrants | Barbados | 0.4 /100 | #263 | Tragic 17.9% |
| Menominee | 0.4 /100 | #264 | Tragic 18.0% |
| Spanish Americans | 0.4 /100 | #265 | Tragic 18.0% |
| Belizeans | 0.4 /100 | #266 | Tragic 18.0% |
| Nepalese | 0.3 /100 | #267 | Tragic 18.0% |
| Cherokee | 0.3 /100 | #268 | Tragic 18.0% |
| Hondurans | 0.3 /100 | #269 | Tragic 18.0% |
| Immigrants | Bahamas | 0.3 /100 | #270 | Tragic 18.0% |
| Potawatomi | 0.2 /100 | #271 | Tragic 18.0% |
| Immigrants | Honduras | 0.2 /100 | #272 | Tragic 18.0% |
| Immigrants | Nepal | 0.2 /100 | #273 | Tragic 18.0% |
| Immigrants | Nigeria | 0.2 /100 | #274 | Tragic 18.0% |
| Immigrants | Laos | 0.2 /100 | #275 | Tragic 18.1% |
| Yuman | 0.2 /100 | #276 | Tragic 18.1% |
| Immigrants | Kuwait | 0.2 /100 | #277 | Tragic 18.1% |
Demographics Similar to Immigrants from Bolivia by Cognitive Disability
In terms of cognitive disability, the demographic groups most similar to Immigrants from Bolivia are Immigrants from Northern Europe (16.3%, a difference of 0.0%), Bulgarian (16.3%, a difference of 0.010%), Immigrants from Cuba (16.3%, a difference of 0.060%), Immigrants from North Macedonia (16.3%, a difference of 0.070%), and Eastern European (16.3%, a difference of 0.090%).
| Demographics | Rating | Rank | Cognitive Disability |
| Maltese | 100.0 /100 | #12 | Exceptional 16.2% |
| Lithuanians | 100.0 /100 | #13 | Exceptional 16.3% |
| Immigrants | Austria | 100.0 /100 | #14 | Exceptional 16.3% |
| Immigrants | Greece | 100.0 /100 | #15 | Exceptional 16.3% |
| Eastern Europeans | 100.0 /100 | #16 | Exceptional 16.3% |
| Immigrants | North Macedonia | 100.0 /100 | #17 | Exceptional 16.3% |
| Immigrants | Northern Europe | 100.0 /100 | #18 | Exceptional 16.3% |
| Immigrants | Bolivia | 100.0 /100 | #19 | Exceptional 16.3% |
| Bulgarians | 100.0 /100 | #20 | Exceptional 16.3% |
| Immigrants | Cuba | 100.0 /100 | #21 | Exceptional 16.3% |
| Immigrants | South Central Asia | 99.9 /100 | #22 | Exceptional 16.4% |
| Croatians | 99.9 /100 | #23 | Exceptional 16.4% |
| Immigrants | Argentina | 99.9 /100 | #24 | Exceptional 16.4% |
| Luxembourgers | 99.9 /100 | #25 | Exceptional 16.4% |
| Immigrants | Croatia | 99.9 /100 | #26 | Exceptional 16.4% |