Immigrants from Bahamas vs Italian Unemployment Among Seniors over 75 years
COMPARE
Immigrants from Bahamas
Italian
Unemployment Among Seniors over 75 years
Unemployment Among Seniors over 75 years Comparison
Immigrants from Bahamas
Italians
8.6%
UNEMPLOYMENT AMONG SENIORS OVER 75 YEARS
76.5/ 100
METRIC RATING
156th/ 347
METRIC RANK
10.0%
UNEMPLOYMENT AMONG SENIORS OVER 75 YEARS
0.0/ 100
METRIC RATING
306th/ 347
METRIC RANK
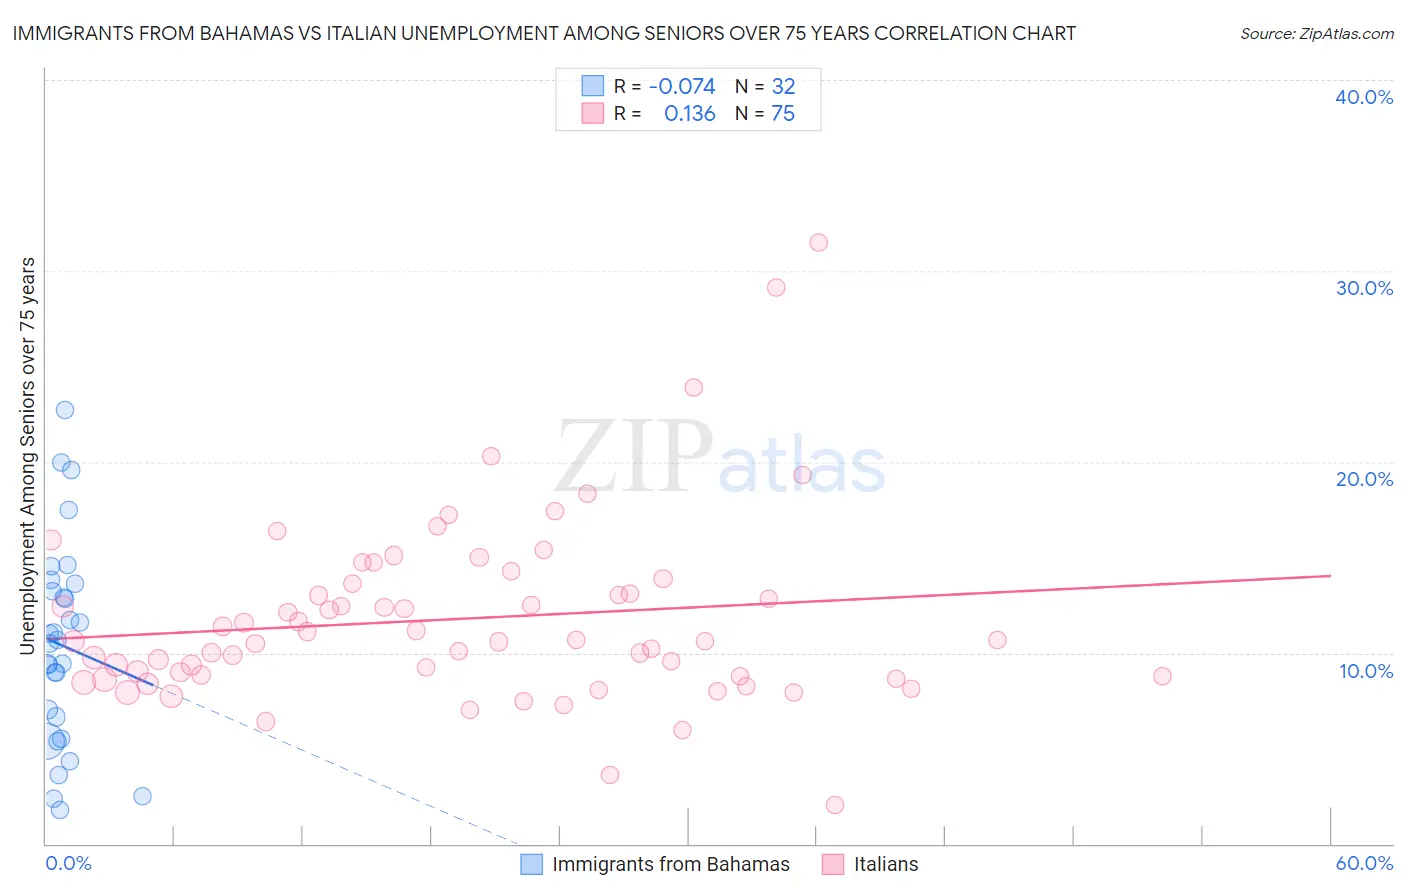
Immigrants from Bahamas vs Italian Unemployment Among Seniors over 75 years Correlation Chart
The statistical analysis conducted on geographies consisting of 77,798,406 people shows a slight negative correlation between the proportion of Immigrants from Bahamas and unemployment rate among seniors over the age of 75 in the United States with a correlation coefficient (R) of -0.074 and weighted average of 8.6%. Similarly, the statistical analysis conducted on geographies consisting of 235,398,566 people shows a poor positive correlation between the proportion of Italians and unemployment rate among seniors over the age of 75 in the United States with a correlation coefficient (R) of 0.136 and weighted average of 10.0%, a difference of 16.3%.
Unemployment Among Seniors over 75 years Correlation Summary
| Measurement | Immigrants from Bahamas | Italian |
| Minimum | 1.8% | 2.0% |
| Maximum | 22.7% | 31.5% |
| Range | 20.9% | 29.5% |
| Mean | 10.4% | 11.8% |
| Median | 10.6% | 10.6% |
| Interquartile 25% (IQ1) | 6.1% | 8.8% |
| Interquartile 75% (IQ3) | 13.4% | 13.6% |
| Interquartile Range (IQR) | 7.3% | 4.8% |
| Standard Deviation (Sample) | 5.2% | 4.8% |
| Standard Deviation (Population) | 5.2% | 4.8% |
Similar Demographics by Unemployment Among Seniors over 75 years
Demographics Similar to Immigrants from Bahamas by Unemployment Among Seniors over 75 years
In terms of unemployment among seniors over 75 years, the demographic groups most similar to Immigrants from Bahamas are Turkish (8.6%, a difference of 0.010%), Ethiopian (8.6%, a difference of 0.090%), Shoshone (8.6%, a difference of 0.14%), Ecuadorian (8.6%, a difference of 0.16%), and Immigrants from Pakistan (8.6%, a difference of 0.26%).
| Demographics | Rating | Rank | Unemployment Among Seniors over 75 years |
| Immigrants | Ecuador | 84.6 /100 | #149 | Excellent 8.5% |
| Paiute | 82.5 /100 | #150 | Excellent 8.6% |
| Immigrants | Bosnia and Herzegovina | 80.6 /100 | #151 | Excellent 8.6% |
| Latvians | 80.5 /100 | #152 | Excellent 8.6% |
| Mongolians | 80.1 /100 | #153 | Excellent 8.6% |
| Immigrants | Pakistan | 79.7 /100 | #154 | Good 8.6% |
| Ecuadorians | 78.5 /100 | #155 | Good 8.6% |
| Immigrants | Bahamas | 76.5 /100 | #156 | Good 8.6% |
| Turks | 76.4 /100 | #157 | Good 8.6% |
| Ethiopians | 75.3 /100 | #158 | Good 8.6% |
| Shoshone | 74.6 /100 | #159 | Good 8.6% |
| Cree | 72.8 /100 | #160 | Good 8.6% |
| Albanians | 72.8 /100 | #161 | Good 8.6% |
| Immigrants | South America | 71.3 /100 | #162 | Good 8.6% |
| Immigrants | Guatemala | 68.4 /100 | #163 | Good 8.7% |
Demographics Similar to Italians by Unemployment Among Seniors over 75 years
In terms of unemployment among seniors over 75 years, the demographic groups most similar to Italians are Immigrants from Fiji (10.0%, a difference of 0.13%), Swedish (10.0%, a difference of 0.15%), Scotch-Irish (10.0%, a difference of 0.34%), Puget Sound Salish (10.0%, a difference of 0.35%), and Finnish (10.0%, a difference of 0.42%).
| Demographics | Rating | Rank | Unemployment Among Seniors over 75 years |
| Belgians | 0.0 /100 | #299 | Tragic 9.9% |
| Iraqis | 0.0 /100 | #300 | Tragic 9.9% |
| Welsh | 0.0 /100 | #301 | Tragic 10.0% |
| Finns | 0.0 /100 | #302 | Tragic 10.0% |
| Puget Sound Salish | 0.0 /100 | #303 | Tragic 10.0% |
| Scotch-Irish | 0.0 /100 | #304 | Tragic 10.0% |
| Swedes | 0.0 /100 | #305 | Tragic 10.0% |
| Italians | 0.0 /100 | #306 | Tragic 10.0% |
| Immigrants | Fiji | 0.0 /100 | #307 | Tragic 10.0% |
| Whites/Caucasians | 0.0 /100 | #308 | Tragic 10.1% |
| English | 0.0 /100 | #309 | Tragic 10.1% |
| Hungarians | 0.0 /100 | #310 | Tragic 10.1% |
| Scottish | 0.0 /100 | #311 | Tragic 10.1% |
| Chippewa | 0.0 /100 | #312 | Tragic 10.1% |
| Nepalese | 0.0 /100 | #313 | Tragic 10.1% |