Kiowa vs Italian Cognitive Disability
COMPARE
Kiowa
Italian
Cognitive Disability
Cognitive Disability Comparison
Kiowa
Italians
18.7%
COGNITIVE DISABILITY
0.0/ 100
METRIC RATING
328th/ 347
METRIC RANK
16.4%
COGNITIVE DISABILITY
99.9/ 100
METRIC RATING
33rd/ 347
METRIC RANK
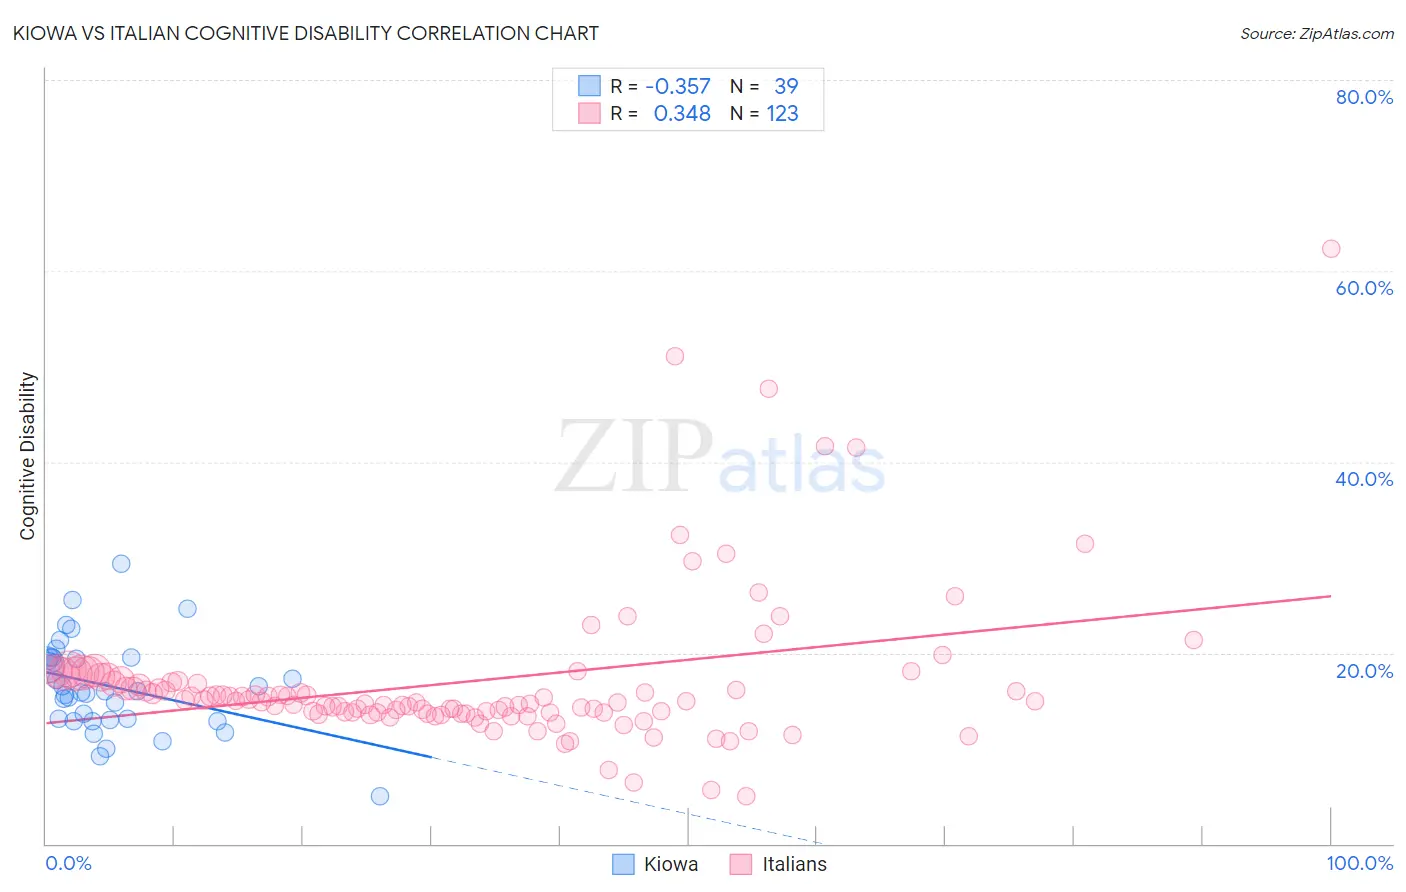
Kiowa vs Italian Cognitive Disability Correlation Chart
The statistical analysis conducted on geographies consisting of 56,098,824 people shows a mild negative correlation between the proportion of Kiowa and percentage of population with cognitive disability in the United States with a correlation coefficient (R) of -0.357 and weighted average of 18.7%. Similarly, the statistical analysis conducted on geographies consisting of 574,911,788 people shows a mild positive correlation between the proportion of Italians and percentage of population with cognitive disability in the United States with a correlation coefficient (R) of 0.348 and weighted average of 16.4%, a difference of 14.0%.
Cognitive Disability Correlation Summary
| Measurement | Kiowa | Italian |
| Minimum | 4.9% | 4.9% |
| Maximum | 29.3% | 62.3% |
| Range | 24.4% | 57.4% |
| Mean | 16.5% | 16.9% |
| Median | 16.0% | 15.0% |
| Interquartile 25% (IQ1) | 12.9% | 13.7% |
| Interquartile 75% (IQ3) | 19.5% | 17.1% |
| Interquartile Range (IQR) | 6.6% | 3.3% |
| Standard Deviation (Sample) | 4.8% | 8.0% |
| Standard Deviation (Population) | 4.8% | 8.0% |
Similar Demographics by Cognitive Disability
Demographics Similar to Kiowa by Cognitive Disability
In terms of cognitive disability, the demographic groups most similar to Kiowa are U.S. Virgin Islander (18.7%, a difference of 0.060%), Immigrants from Senegal (18.7%, a difference of 0.10%), Indonesian (18.7%, a difference of 0.12%), Dominican (18.7%, a difference of 0.20%), and Navajo (18.8%, a difference of 0.22%).
| Demographics | Rating | Rank | Cognitive Disability |
| Africans | 0.0 /100 | #321 | Tragic 18.6% |
| Immigrants | Liberia | 0.0 /100 | #322 | Tragic 18.7% |
| Pueblo | 0.0 /100 | #323 | Tragic 18.7% |
| Dominicans | 0.0 /100 | #324 | Tragic 18.7% |
| Indonesians | 0.0 /100 | #325 | Tragic 18.7% |
| Immigrants | Senegal | 0.0 /100 | #326 | Tragic 18.7% |
| U.S. Virgin Islanders | 0.0 /100 | #327 | Tragic 18.7% |
| Kiowa | 0.0 /100 | #328 | Tragic 18.7% |
| Navajo | 0.0 /100 | #329 | Tragic 18.8% |
| Immigrants | Dominican Republic | 0.0 /100 | #330 | Tragic 18.8% |
| Pima | 0.0 /100 | #331 | Tragic 18.8% |
| Immigrants | Sudan | 0.0 /100 | #332 | Tragic 18.8% |
| Immigrants | Yemen | 0.0 /100 | #333 | Tragic 18.8% |
| Sudanese | 0.0 /100 | #334 | Tragic 18.9% |
| Senegalese | 0.0 /100 | #335 | Tragic 19.0% |
Demographics Similar to Italians by Cognitive Disability
In terms of cognitive disability, the demographic groups most similar to Italians are Russian (16.4%, a difference of 0.0%), Immigrants from Israel (16.4%, a difference of 0.070%), Slovak (16.4%, a difference of 0.080%), Greek (16.4%, a difference of 0.090%), and Immigrants from Romania (16.4%, a difference of 0.13%).
| Demographics | Rating | Rank | Cognitive Disability |
| Immigrants | Croatia | 99.9 /100 | #26 | Exceptional 16.4% |
| Immigrants | Pakistan | 99.9 /100 | #27 | Exceptional 16.4% |
| Poles | 99.9 /100 | #28 | Exceptional 16.4% |
| Filipinos | 99.9 /100 | #29 | Exceptional 16.4% |
| Czechs | 99.9 /100 | #30 | Exceptional 16.4% |
| Immigrants | Romania | 99.9 /100 | #31 | Exceptional 16.4% |
| Immigrants | Israel | 99.9 /100 | #32 | Exceptional 16.4% |
| Italians | 99.9 /100 | #33 | Exceptional 16.4% |
| Russians | 99.9 /100 | #34 | Exceptional 16.4% |
| Slovaks | 99.9 /100 | #35 | Exceptional 16.4% |
| Greeks | 99.9 /100 | #36 | Exceptional 16.4% |
| Slovenes | 99.9 /100 | #37 | Exceptional 16.5% |
| Immigrants | Eastern Europe | 99.9 /100 | #38 | Exceptional 16.5% |
| Bolivians | 99.9 /100 | #39 | Exceptional 16.5% |
| Immigrants | Belarus | 99.9 /100 | #40 | Exceptional 16.5% |