Immigrants from Bahamas vs Iroquois Cognitive Disability
COMPARE
Immigrants from Bahamas
Iroquois
Cognitive Disability
Cognitive Disability Comparison
Immigrants from Bahamas
Iroquois
18.0%
COGNITIVE DISABILITY
0.3/ 100
METRIC RATING
270th/ 347
METRIC RANK
18.2%
COGNITIVE DISABILITY
0.1/ 100
METRIC RATING
292nd/ 347
METRIC RANK
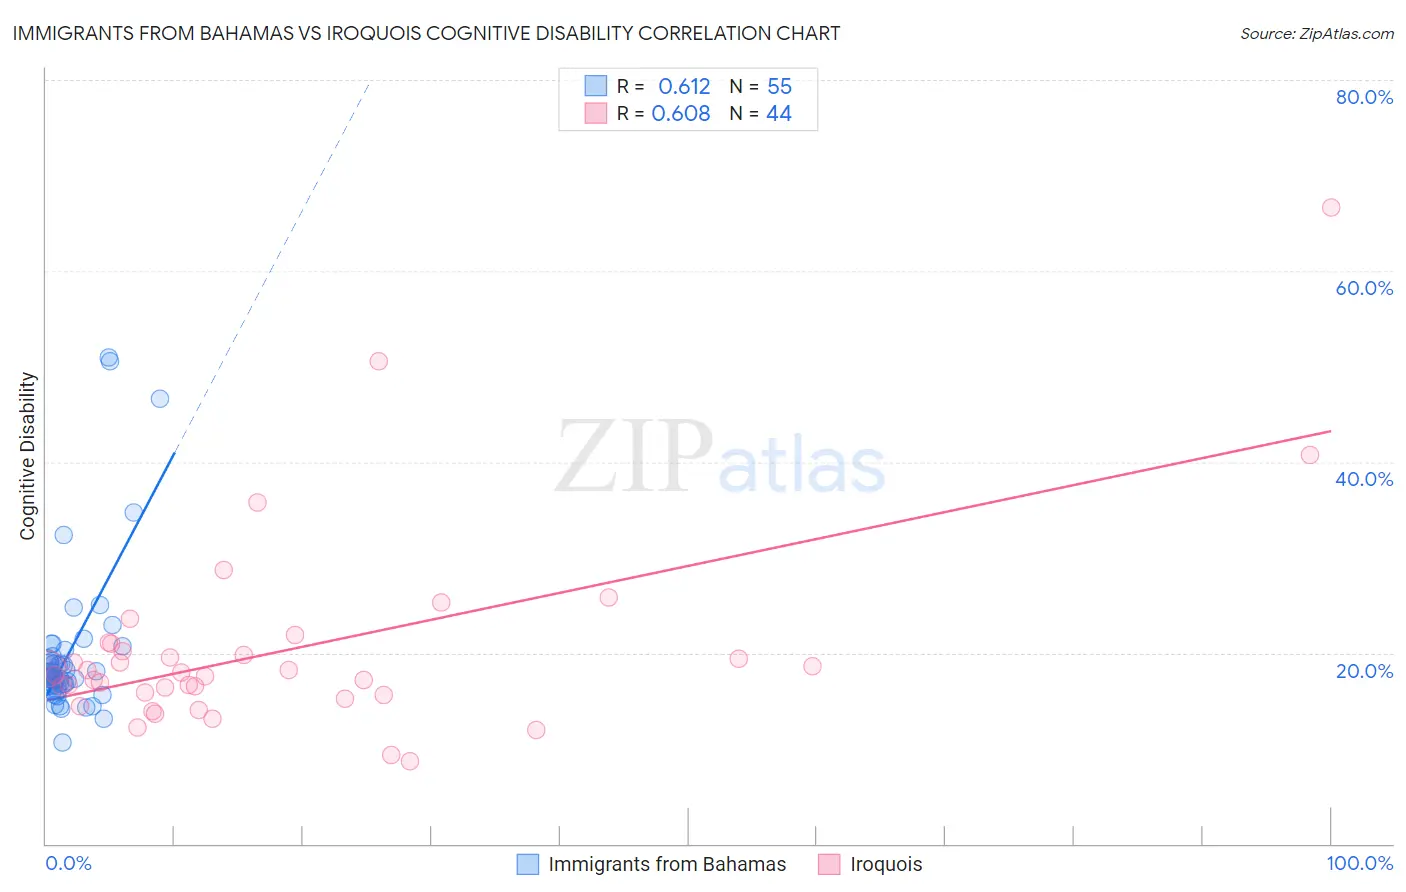
Immigrants from Bahamas vs Iroquois Cognitive Disability Correlation Chart
The statistical analysis conducted on geographies consisting of 104,656,442 people shows a significant positive correlation between the proportion of Immigrants from Bahamas and percentage of population with cognitive disability in the United States with a correlation coefficient (R) of 0.612 and weighted average of 18.0%. Similarly, the statistical analysis conducted on geographies consisting of 207,276,810 people shows a significant positive correlation between the proportion of Iroquois and percentage of population with cognitive disability in the United States with a correlation coefficient (R) of 0.608 and weighted average of 18.2%, a difference of 0.99%.
Cognitive Disability Correlation Summary
| Measurement | Immigrants from Bahamas | Iroquois |
| Minimum | 10.6% | 8.7% |
| Maximum | 51.0% | 66.7% |
| Range | 40.4% | 58.0% |
| Mean | 20.0% | 20.3% |
| Median | 17.6% | 17.8% |
| Interquartile 25% (IQ1) | 16.5% | 15.7% |
| Interquartile 75% (IQ3) | 19.6% | 20.6% |
| Interquartile Range (IQR) | 3.1% | 4.8% |
| Standard Deviation (Sample) | 8.2% | 10.4% |
| Standard Deviation (Population) | 8.1% | 10.3% |
Similar Demographics by Cognitive Disability
Demographics Similar to Immigrants from Bahamas by Cognitive Disability
In terms of cognitive disability, the demographic groups most similar to Immigrants from Bahamas are Honduran (18.0%, a difference of 0.010%), Potawatomi (18.0%, a difference of 0.070%), Immigrants from Honduras (18.0%, a difference of 0.090%), Cherokee (18.0%, a difference of 0.15%), and Nepalese (18.0%, a difference of 0.16%).
| Demographics | Rating | Rank | Cognitive Disability |
| Immigrants | Barbados | 0.4 /100 | #263 | Tragic 17.9% |
| Menominee | 0.4 /100 | #264 | Tragic 18.0% |
| Spanish Americans | 0.4 /100 | #265 | Tragic 18.0% |
| Belizeans | 0.4 /100 | #266 | Tragic 18.0% |
| Nepalese | 0.3 /100 | #267 | Tragic 18.0% |
| Cherokee | 0.3 /100 | #268 | Tragic 18.0% |
| Hondurans | 0.3 /100 | #269 | Tragic 18.0% |
| Immigrants | Bahamas | 0.3 /100 | #270 | Tragic 18.0% |
| Potawatomi | 0.2 /100 | #271 | Tragic 18.0% |
| Immigrants | Honduras | 0.2 /100 | #272 | Tragic 18.0% |
| Immigrants | Nepal | 0.2 /100 | #273 | Tragic 18.0% |
| Immigrants | Nigeria | 0.2 /100 | #274 | Tragic 18.0% |
| Immigrants | Laos | 0.2 /100 | #275 | Tragic 18.1% |
| Yuman | 0.2 /100 | #276 | Tragic 18.1% |
| Immigrants | Kuwait | 0.2 /100 | #277 | Tragic 18.1% |
Demographics Similar to Iroquois by Cognitive Disability
In terms of cognitive disability, the demographic groups most similar to Iroquois are Central American Indian (18.2%, a difference of 0.010%), Ottawa (18.2%, a difference of 0.070%), British West Indian (18.2%, a difference of 0.080%), Immigrants from Africa (18.1%, a difference of 0.20%), and Native/Alaskan (18.1%, a difference of 0.23%).
| Demographics | Rating | Rank | Cognitive Disability |
| Bermudans | 0.1 /100 | #285 | Tragic 18.1% |
| Kenyans | 0.1 /100 | #286 | Tragic 18.1% |
| Dutch West Indians | 0.1 /100 | #287 | Tragic 18.1% |
| Immigrants | West Indies | 0.1 /100 | #288 | Tragic 18.1% |
| Natives/Alaskans | 0.1 /100 | #289 | Tragic 18.1% |
| Immigrants | Africa | 0.1 /100 | #290 | Tragic 18.1% |
| Ottawa | 0.1 /100 | #291 | Tragic 18.2% |
| Iroquois | 0.1 /100 | #292 | Tragic 18.2% |
| Central American Indians | 0.1 /100 | #293 | Tragic 18.2% |
| British West Indians | 0.1 /100 | #294 | Tragic 18.2% |
| German Russians | 0.0 /100 | #295 | Tragic 18.2% |
| Immigrants | Burma/Myanmar | 0.0 /100 | #296 | Tragic 18.2% |
| Blackfeet | 0.0 /100 | #297 | Tragic 18.3% |
| Japanese | 0.0 /100 | #298 | Tragic 18.3% |
| Ghanaians | 0.0 /100 | #299 | Tragic 18.3% |