Immigrants from the Azores vs Immigrants from Greece Self-Care Disability
COMPARE
Immigrants from the Azores
Immigrants from Greece
Self-Care Disability
Self-Care Disability Comparison
Immigrants from the Azores
Immigrants from Greece
3.0%
SELF-CARE DISABILITY
0.0/ 100
METRIC RATING
335th/ 347
METRIC RANK
2.5%
SELF-CARE DISABILITY
57.3/ 100
METRIC RATING
167th/ 347
METRIC RANK
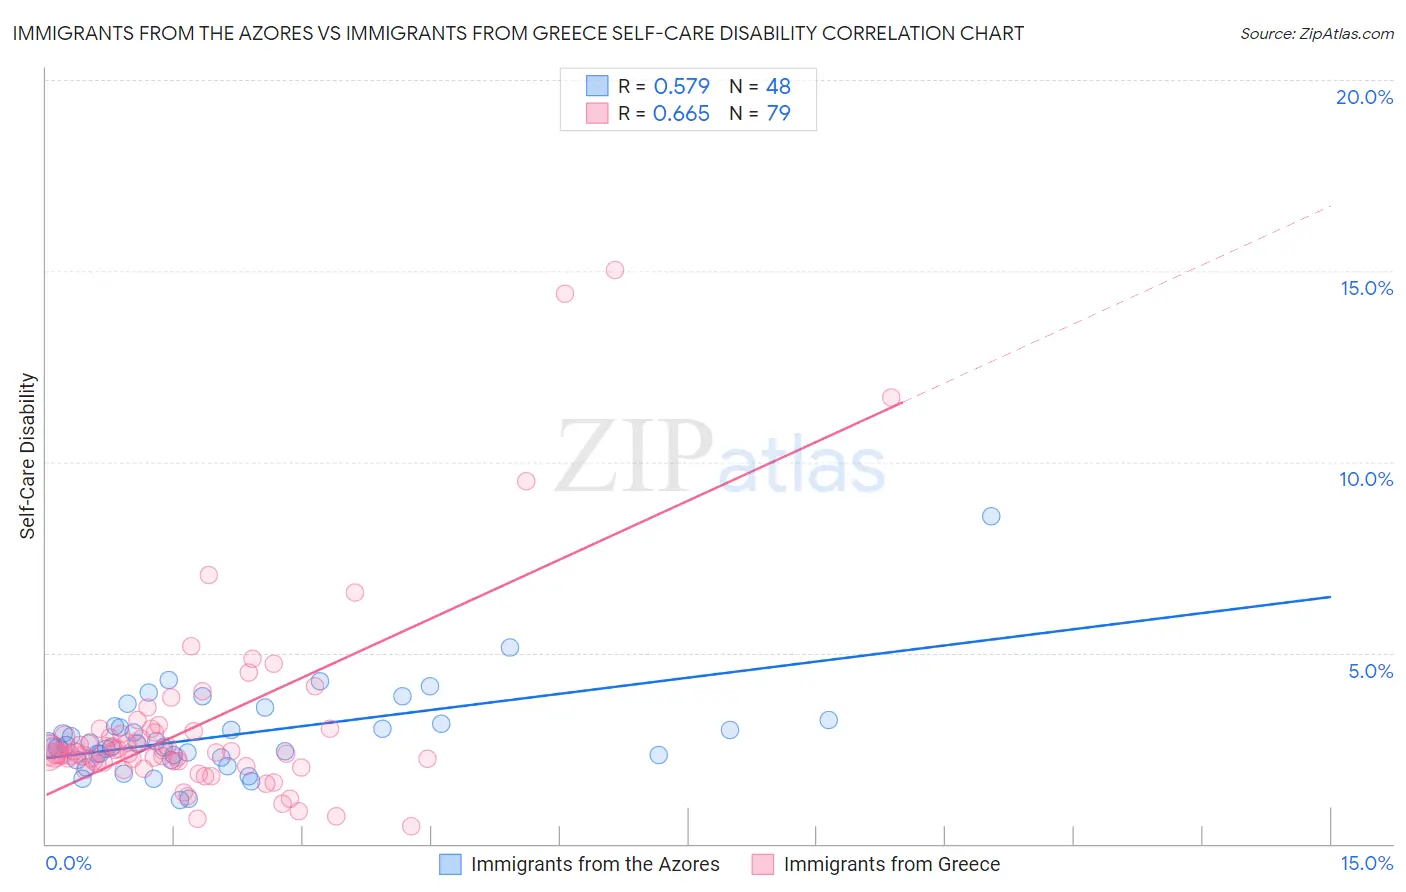
Immigrants from the Azores vs Immigrants from Greece Self-Care Disability Correlation Chart
The statistical analysis conducted on geographies consisting of 46,255,700 people shows a substantial positive correlation between the proportion of Immigrants from the Azores and percentage of population with self-care disability in the United States with a correlation coefficient (R) of 0.579 and weighted average of 3.0%. Similarly, the statistical analysis conducted on geographies consisting of 216,801,636 people shows a significant positive correlation between the proportion of Immigrants from Greece and percentage of population with self-care disability in the United States with a correlation coefficient (R) of 0.665 and weighted average of 2.5%, a difference of 21.5%.
Self-Care Disability Correlation Summary
| Measurement | Immigrants from the Azores | Immigrants from Greece |
| Minimum | 1.1% | 0.45% |
| Maximum | 8.6% | 15.0% |
| Range | 7.4% | 14.6% |
| Mean | 2.9% | 3.1% |
| Median | 2.6% | 2.4% |
| Interquartile 25% (IQ1) | 2.3% | 2.1% |
| Interquartile 75% (IQ3) | 3.1% | 2.9% |
| Interquartile Range (IQR) | 0.84% | 0.81% |
| Standard Deviation (Sample) | 1.2% | 2.5% |
| Standard Deviation (Population) | 1.2% | 2.5% |
Similar Demographics by Self-Care Disability
Demographics Similar to Immigrants from the Azores by Self-Care Disability
In terms of self-care disability, the demographic groups most similar to Immigrants from the Azores are Houma (3.0%, a difference of 0.050%), Dutch West Indian (3.0%, a difference of 0.12%), Immigrants from Yemen (3.0%, a difference of 0.16%), Kiowa (3.0%, a difference of 0.35%), and Lumbee (3.0%, a difference of 0.71%).
| Demographics | Rating | Rank | Self-Care Disability |
| Hopi | 0.0 /100 | #328 | Tragic 2.9% |
| Cajuns | 0.0 /100 | #329 | Tragic 2.9% |
| Nepalese | 0.0 /100 | #330 | Tragic 3.0% |
| Lumbee | 0.0 /100 | #331 | Tragic 3.0% |
| Kiowa | 0.0 /100 | #332 | Tragic 3.0% |
| Dutch West Indians | 0.0 /100 | #333 | Tragic 3.0% |
| Houma | 0.0 /100 | #334 | Tragic 3.0% |
| Immigrants | Azores | 0.0 /100 | #335 | Tragic 3.0% |
| Immigrants | Yemen | 0.0 /100 | #336 | Tragic 3.0% |
| Choctaw | 0.0 /100 | #337 | Tragic 3.0% |
| Cape Verdeans | 0.0 /100 | #338 | Tragic 3.0% |
| Immigrants | Dominican Republic | 0.0 /100 | #339 | Tragic 3.0% |
| Immigrants | Cabo Verde | 0.0 /100 | #340 | Tragic 3.1% |
| Dominicans | 0.0 /100 | #341 | Tragic 3.1% |
| Colville | 0.0 /100 | #342 | Tragic 3.1% |
Demographics Similar to Immigrants from Greece by Self-Care Disability
In terms of self-care disability, the demographic groups most similar to Immigrants from Greece are Ute (2.5%, a difference of 0.010%), Canadian (2.5%, a difference of 0.070%), Immigrants from Somalia (2.5%, a difference of 0.070%), Syrian (2.5%, a difference of 0.080%), and Immigrants from Vietnam (2.5%, a difference of 0.10%).
| Demographics | Rating | Rank | Self-Care Disability |
| Finns | 67.0 /100 | #160 | Good 2.4% |
| Lebanese | 66.5 /100 | #161 | Good 2.4% |
| Somalis | 63.7 /100 | #162 | Good 2.5% |
| German Russians | 62.7 /100 | #163 | Good 2.5% |
| Immigrants | Vietnam | 59.3 /100 | #164 | Average 2.5% |
| Syrians | 59.0 /100 | #165 | Average 2.5% |
| Canadians | 58.8 /100 | #166 | Average 2.5% |
| Immigrants | Greece | 57.3 /100 | #167 | Average 2.5% |
| Ute | 57.1 /100 | #168 | Average 2.5% |
| Immigrants | Somalia | 55.9 /100 | #169 | Average 2.5% |
| Scottish | 54.3 /100 | #170 | Average 2.5% |
| Pennsylvania Germans | 53.5 /100 | #171 | Average 2.5% |
| Czechoslovakians | 53.5 /100 | #172 | Average 2.5% |
| Immigrants | Burma/Myanmar | 52.8 /100 | #173 | Average 2.5% |
| Welsh | 50.0 /100 | #174 | Average 2.5% |