Immigrants from Austria vs Immigrants from Colombia Ambulatory Disability
COMPARE
Immigrants from Austria
Immigrants from Colombia
Ambulatory Disability
Ambulatory Disability Comparison
Immigrants from Austria
Immigrants from Colombia
6.0%
AMBULATORY DISABILITY
78.8/ 100
METRIC RATING
152nd/ 347
METRIC RANK
5.8%
AMBULATORY DISABILITY
96.7/ 100
METRIC RATING
110th/ 347
METRIC RANK
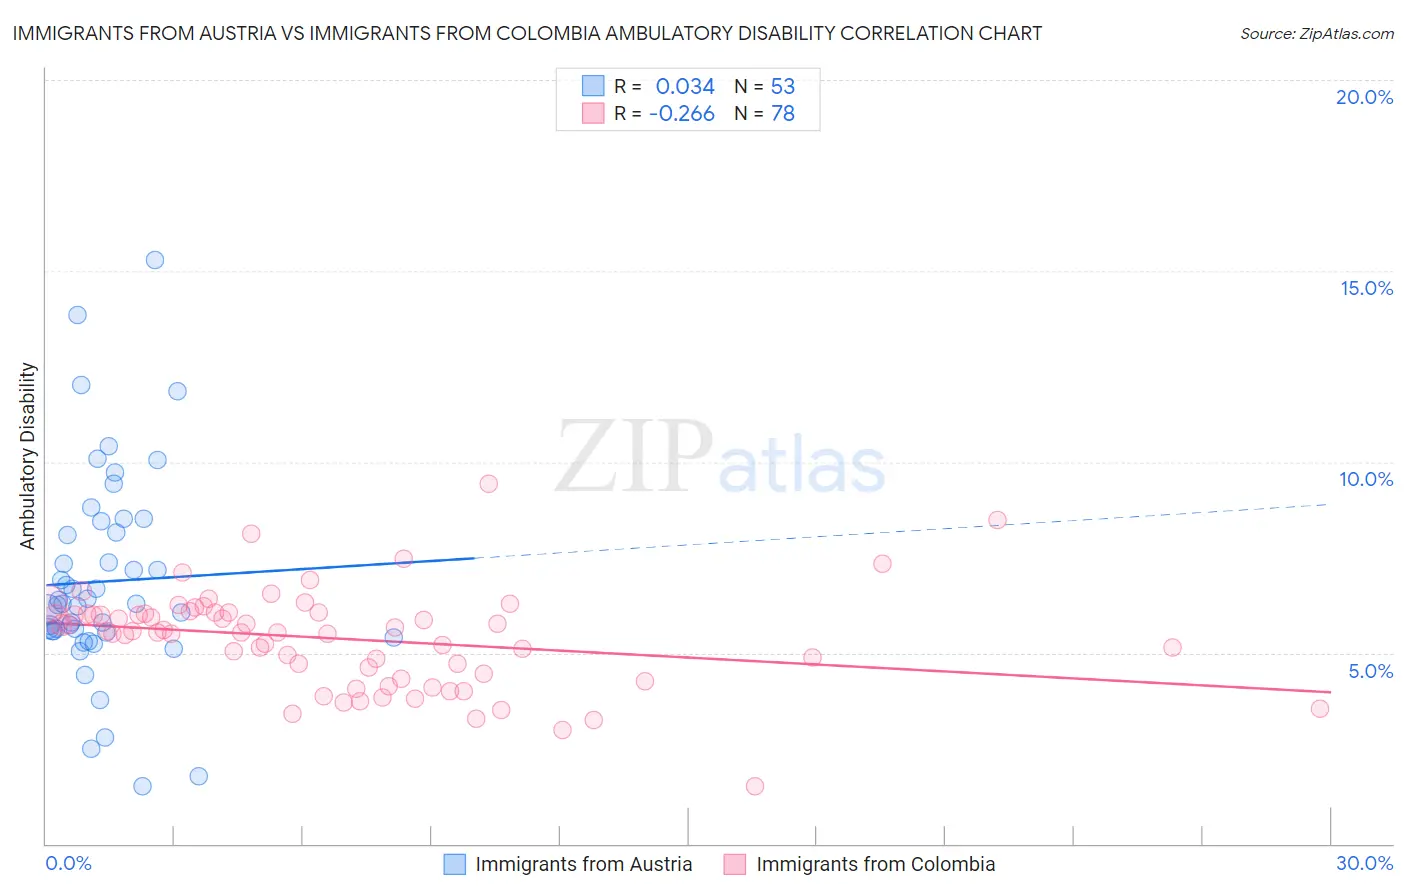
Immigrants from Austria vs Immigrants from Colombia Ambulatory Disability Correlation Chart
The statistical analysis conducted on geographies consisting of 167,968,225 people shows no correlation between the proportion of Immigrants from Austria and percentage of population with ambulatory disability in the United States with a correlation coefficient (R) of 0.034 and weighted average of 6.0%. Similarly, the statistical analysis conducted on geographies consisting of 378,592,310 people shows a weak negative correlation between the proportion of Immigrants from Colombia and percentage of population with ambulatory disability in the United States with a correlation coefficient (R) of -0.266 and weighted average of 5.8%, a difference of 2.9%.
Ambulatory Disability Correlation Summary
| Measurement | Immigrants from Austria | Immigrants from Colombia |
| Minimum | 1.5% | 1.5% |
| Maximum | 15.3% | 9.4% |
| Range | 13.8% | 7.9% |
| Mean | 6.9% | 5.4% |
| Median | 6.3% | 5.6% |
| Interquartile 25% (IQ1) | 5.6% | 4.5% |
| Interquartile 75% (IQ3) | 8.3% | 6.0% |
| Interquartile Range (IQR) | 2.7% | 1.6% |
| Standard Deviation (Sample) | 2.7% | 1.3% |
| Standard Deviation (Population) | 2.7% | 1.3% |
Similar Demographics by Ambulatory Disability
Demographics Similar to Immigrants from Austria by Ambulatory Disability
In terms of ambulatory disability, the demographic groups most similar to Immigrants from Austria are Greek (6.0%, a difference of 0.070%), Maltese (6.0%, a difference of 0.25%), Syrian (6.0%, a difference of 0.25%), Lithuanian (6.0%, a difference of 0.27%), and Immigrants from Eastern Europe (6.0%, a difference of 0.28%).
| Demographics | Rating | Rank | Ambulatory Disability |
| Pakistanis | 82.5 /100 | #145 | Excellent 6.0% |
| Immigrants | Greece | 82.5 /100 | #146 | Excellent 6.0% |
| Immigrants | Moldova | 82.4 /100 | #147 | Excellent 6.0% |
| Immigrants | Eastern Europe | 82.0 /100 | #148 | Excellent 6.0% |
| Lithuanians | 81.9 /100 | #149 | Excellent 6.0% |
| Maltese | 81.6 /100 | #150 | Excellent 6.0% |
| Greeks | 79.6 /100 | #151 | Good 6.0% |
| Immigrants | Austria | 78.8 /100 | #152 | Good 6.0% |
| Syrians | 75.5 /100 | #153 | Good 6.0% |
| Immigrants | Croatia | 75.1 /100 | #154 | Good 6.0% |
| Immigrants | Scotland | 72.1 /100 | #155 | Good 6.0% |
| Northern Europeans | 71.8 /100 | #156 | Good 6.0% |
| Ghanaians | 71.3 /100 | #157 | Good 6.0% |
| Immigrants | Fiji | 71.2 /100 | #158 | Good 6.0% |
| Immigrants | Latvia | 71.1 /100 | #159 | Good 6.0% |
Demographics Similar to Immigrants from Colombia by Ambulatory Disability
In terms of ambulatory disability, the demographic groups most similar to Immigrants from Colombia are Danish (5.8%, a difference of 0.070%), Immigrants from Netherlands (5.8%, a difference of 0.18%), Colombian (5.8%, a difference of 0.19%), South African (5.9%, a difference of 0.20%), and Uruguayan (5.8%, a difference of 0.21%).
| Demographics | Rating | Rank | Ambulatory Disability |
| Immigrants | Romania | 97.7 /100 | #103 | Exceptional 5.8% |
| New Zealanders | 97.6 /100 | #104 | Exceptional 5.8% |
| Immigrants | Czechoslovakia | 97.4 /100 | #105 | Exceptional 5.8% |
| Immigrants | Morocco | 97.3 /100 | #106 | Exceptional 5.8% |
| Uruguayans | 97.2 /100 | #107 | Exceptional 5.8% |
| Colombians | 97.2 /100 | #108 | Exceptional 5.8% |
| Immigrants | Netherlands | 97.1 /100 | #109 | Exceptional 5.8% |
| Immigrants | Colombia | 96.7 /100 | #110 | Exceptional 5.8% |
| Danes | 96.6 /100 | #111 | Exceptional 5.8% |
| South Africans | 96.3 /100 | #112 | Exceptional 5.9% |
| Immigrants | Uruguay | 95.6 /100 | #113 | Exceptional 5.9% |
| Immigrants | Poland | 95.4 /100 | #114 | Exceptional 5.9% |
| South American Indians | 94.8 /100 | #115 | Exceptional 5.9% |
| Immigrants | Africa | 94.7 /100 | #116 | Exceptional 5.9% |
| Immigrants | South Eastern Asia | 93.6 /100 | #117 | Exceptional 5.9% |