Immigrants from Austria vs Estonian Median Earnings
COMPARE
Immigrants from Austria
Estonian
Median Earnings
Median Earnings Comparison
Immigrants from Austria
Estonians
$51,826
MEDIAN EARNINGS
99.9/ 100
METRIC RATING
51st/ 347
METRIC RANK
$51,772
MEDIAN EARNINGS
99.9/ 100
METRIC RATING
52nd/ 347
METRIC RANK
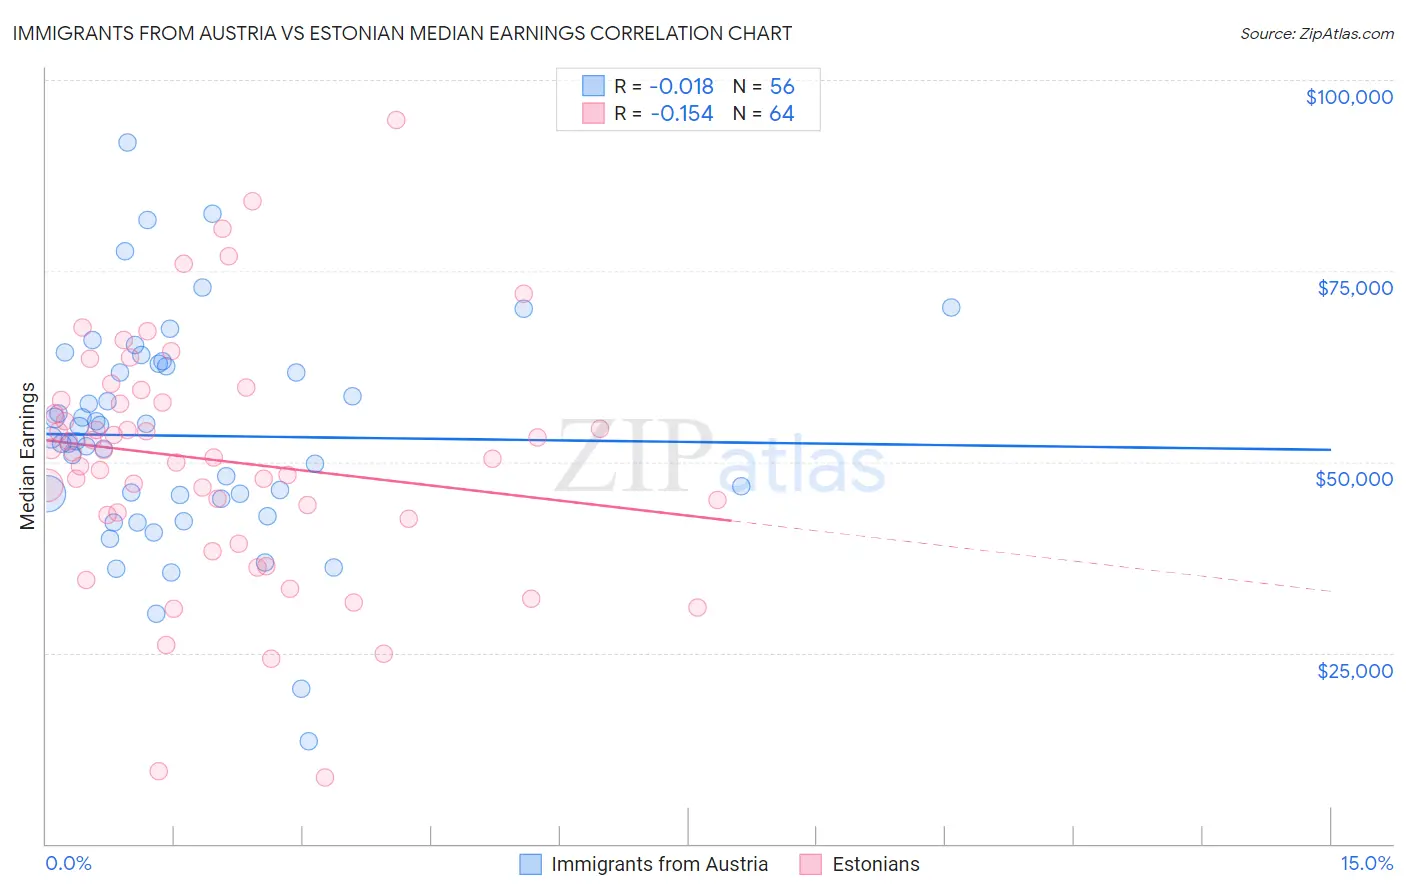
Immigrants from Austria vs Estonian Median Earnings Correlation Chart
The statistical analysis conducted on geographies consisting of 167,962,840 people shows no correlation between the proportion of Immigrants from Austria and median earnings in the United States with a correlation coefficient (R) of -0.018 and weighted average of $51,826. Similarly, the statistical analysis conducted on geographies consisting of 123,525,631 people shows a poor negative correlation between the proportion of Estonians and median earnings in the United States with a correlation coefficient (R) of -0.154 and weighted average of $51,772, a difference of 0.10%.
Median Earnings Correlation Summary
| Measurement | Immigrants from Austria | Estonian |
| Minimum | $13,446 | $8,672 |
| Maximum | $91,775 | $94,792 |
| Range | $78,329 | $86,120 |
| Mean | $53,408 | $50,194 |
| Median | $52,944 | $50,958 |
| Interquartile 25% (IQ1) | $45,427 | $42,740 |
| Interquartile 75% (IQ3) | $62,672 | $57,865 |
| Interquartile Range (IQR) | $17,245 | $15,125 |
| Standard Deviation (Sample) | $14,505 | $15,990 |
| Standard Deviation (Population) | $14,375 | $15,865 |
Demographics Similar to Immigrants from Austria and Estonians by Median Earnings
In terms of median earnings, the demographic groups most similar to Immigrants from Austria are Immigrants from South Africa ($51,850, a difference of 0.050%), Immigrants from Norway ($51,758, a difference of 0.13%), Immigrants from Indonesia ($51,715, a difference of 0.21%), Egyptian ($51,701, a difference of 0.24%), and Immigrants from Pakistan ($51,693, a difference of 0.26%). Similarly, the demographic groups most similar to Estonians are Immigrants from Norway ($51,758, a difference of 0.030%), Immigrants from Indonesia ($51,715, a difference of 0.11%), Egyptian ($51,701, a difference of 0.14%), Immigrants from South Africa ($51,850, a difference of 0.15%), and Immigrants from Pakistan ($51,693, a difference of 0.15%).
| Demographics | Rating | Rank | Median Earnings |
| Immigrants | Lithuania | 100.0 /100 | #41 | Exceptional $52,769 |
| Maltese | 100.0 /100 | #42 | Exceptional $52,526 |
| Immigrants | Malaysia | 100.0 /100 | #43 | Exceptional $52,514 |
| Bulgarians | 100.0 /100 | #44 | Exceptional $52,512 |
| Immigrants | Czechoslovakia | 100.0 /100 | #45 | Exceptional $52,361 |
| Bhutanese | 100.0 /100 | #46 | Exceptional $52,297 |
| Australians | 100.0 /100 | #47 | Exceptional $52,294 |
| Immigrants | Europe | 100.0 /100 | #48 | Exceptional $52,195 |
| Bolivians | 100.0 /100 | #49 | Exceptional $52,005 |
| Immigrants | South Africa | 100.0 /100 | #50 | Exceptional $51,850 |
| Immigrants | Austria | 99.9 /100 | #51 | Exceptional $51,826 |
| Estonians | 99.9 /100 | #52 | Exceptional $51,772 |
| Immigrants | Norway | 99.9 /100 | #53 | Exceptional $51,758 |
| Immigrants | Indonesia | 99.9 /100 | #54 | Exceptional $51,715 |
| Egyptians | 99.9 /100 | #55 | Exceptional $51,701 |
| Immigrants | Pakistan | 99.9 /100 | #56 | Exceptional $51,693 |
| Immigrants | Eastern Europe | 99.9 /100 | #57 | Exceptional $51,624 |
| Immigrants | Bolivia | 99.9 /100 | #58 | Exceptional $51,605 |
| Immigrants | Croatia | 99.9 /100 | #59 | Exceptional $51,581 |
| Immigrants | Serbia | 99.9 /100 | #60 | Exceptional $51,557 |
| Immigrants | Latvia | 99.9 /100 | #61 | Exceptional $51,555 |