Immigrants from Asia vs Immigrants from Ukraine Disability Age 5 to 17

COMPARE

Immigrants from Asia
Race
Ancestry
AfghanAfricanAlaska NativeAlaskan AthabascanAlbanianAleutAlsatianAmericanApacheArabArapahoArgentineanArmenianAssyrian/Chaldean/SyriacAustralianAustrianBahamianBangladeshiBarbadianBasqueBelgianBelizeanBermudanBhutaneseBlackfeetBolivianBrazilianBritishBritish West IndianBulgarianBurmeseCajunCambodianCanadianCape VerdeanCarpatho RusynCelticCentral AmericanCentral American IndianCherokeeCheyenneChickasawChileanChineseChippewaChoctawColombianColvilleComancheCosta RicanCreeCreekCroatianCrowCubanCypriotCzechCzechoslovakianDanishDelawareDominicanDutchDutch West IndianEastern EuropeanEcuadorianEgyptianEnglishEstonianEthiopianEuropeanFijianFilipinoFinnishFrenchFrench American IndianFrench CanadianGermanGerman RussianGhanaianGreekGuamanian/ChamorroGuatemalanGuyaneseHaitianHmongHonduranHopiHoumaHungarianIcelanderIndian (Asian)IndonesianInupiatIranianIraqiIrishIroquoisIsraeliItalianJamaicanJapaneseJordanianKenyanKiowaKoreanLaotianLatvianLebaneseLiberianLithuanianLumbeeLuxembourgerMacedonianMalaysianMalteseMarshalleseMenomineeMexicanMexican American IndianMongolianMoroccanNative HawaiianNavajoNepaleseNew ZealanderNicaraguanNigerianNorthern EuropeanNorwegianOkinawanOsageOttawaPaiutePakistaniPalestinianPanamanianParaguayanPennsylvania GermanPeruvianPimaPolishPortuguesePotawatomiPuebloPuerto RicanPuget Sound SalishRomanianRussianSalvadoranSamoanScandinavianScotch-IrishScottishSeminoleSenegaleseSerbianShoshoneSierra LeoneanSiouxSlavicSlovakSloveneSomaliSouth AfricanSouth AmericanSouth American IndianSoviet UnionSpaniardSpanishSpanish AmericanSpanish American IndianSri LankanSubsaharan AfricanSudaneseSwedishSwissSyrianTaiwaneseThaiTlingit-HaidaTohono O'OdhamTonganTrinidadian and TobagonianTsimshianTurkishU.S. Virgin IslanderUgandanUkrainianUruguayanUteVenezuelanVietnameseWelshWest IndianYakamaYaquiYugoslavianYumanYup'ikZimbabwean
Immigration
NonimmigrantsImmigrantsAfghanistanAfricaAlbaniaArgentinaArmeniaAsiaAustraliaAustriaBahamasBangladeshBarbadosBelarusBelgiumBelizeBoliviaBosnia and HerzegovinaBrazilBulgariaBurma/MyanmarCabo VerdeCambodiaCameroonCanadaCaribbeanCentral AmericaChileChinaColombiaCongoCosta RicaCroatiaCubaCzechoslovakiaDenmarkDominicaDominican RepublicEastern AfricaEastern AsiaEastern EuropeEcuadorEgyptEl SalvadorEnglandEritreaEthiopiaEuropeFijiFranceGermanyGhanaGreeceGrenadaGuatemalaGuyanaHaitiHondurasHong KongHungaryIndiaIndonesiaIranIraqIrelandIsraelItalyJamaicaJapanJordanKazakhstanKenyaKoreaKuwaitLaosLatin AmericaLatviaLebanonLiberiaLithuaniaMalaysiaMexicoMicronesiaMiddle AfricaMoldovaMoroccoNepalNetherlandsNicaraguaNigeriaNorth AmericaNorth MacedoniaNorthern AfricaNorthern EuropeNorwayOceaniaPakistanPanamaPeruPhilippinesPolandPortugalRomaniaRussiaSaudi ArabiaScotlandSenegalSerbiaSierra LeoneSingaporeSomaliaSouth AfricaSouth AmericaSouth Central AsiaSouth Eastern AsiaSouthern EuropeSpainSri LankaSt. Vincent and the GrenadinesSudanSwedenSwitzerlandSyriaTaiwanThailandTrinidad and TobagoTurkeyUgandaUruguayUzbekistanVenezuelaVietnamWest IndiesWestern AfricaWestern AsiaWestern EuropeYemenZaireZimbabweAzores
Immigrants from Ukraine
Race
Ancestry
AfghanAfricanAlaska NativeAlaskan AthabascanAlbanianAleutAlsatianAmericanApacheArabArapahoArgentineanArmenianAssyrian/Chaldean/SyriacAustralianAustrianBahamianBangladeshiBarbadianBasqueBelgianBelizeanBermudanBhutaneseBlackfeetBolivianBrazilianBritishBritish West IndianBulgarianBurmeseCajunCambodianCanadianCape VerdeanCarpatho RusynCelticCentral AmericanCentral American IndianCherokeeCheyenneChickasawChileanChineseChippewaChoctawColombianColvilleComancheCosta RicanCreeCreekCroatianCrowCubanCypriotCzechCzechoslovakianDanishDelawareDominicanDutchDutch West IndianEastern EuropeanEcuadorianEgyptianEnglishEstonianEthiopianEuropeanFijianFilipinoFinnishFrenchFrench American IndianFrench CanadianGermanGerman RussianGhanaianGreekGuamanian/ChamorroGuatemalanGuyaneseHaitianHmongHonduranHopiHoumaHungarianIcelanderIndian (Asian)IndonesianInupiatIranianIraqiIrishIroquoisIsraeliItalianJamaicanJapaneseJordanianKenyanKiowaKoreanLaotianLatvianLebaneseLiberianLithuanianLumbeeLuxembourgerMacedonianMalaysianMalteseMarshalleseMenomineeMexicanMexican American IndianMongolianMoroccanNative HawaiianNavajoNepaleseNew ZealanderNicaraguanNigerianNorthern EuropeanNorwegianOkinawanOsageOttawaPaiutePakistaniPalestinianPanamanianParaguayanPennsylvania GermanPeruvianPimaPolishPortuguesePotawatomiPuebloPuerto RicanPuget Sound SalishRomanianRussianSalvadoranSamoanScandinavianScotch-IrishScottishSeminoleSenegaleseSerbianShoshoneSierra LeoneanSiouxSlavicSlovakSloveneSomaliSouth AfricanSouth AmericanSouth American IndianSoviet UnionSpaniardSpanishSpanish AmericanSpanish American IndianSri LankanSubsaharan AfricanSudaneseSwedishSwissSyrianTaiwaneseThaiTlingit-HaidaTohono O'OdhamTonganTrinidadian and TobagonianTsimshianTurkishU.S. Virgin IslanderUgandanUkrainianUruguayanUteVenezuelanVietnameseWelshWest IndianYakamaYaquiYugoslavianYumanYup'ikZimbabwean
Immigration
NonimmigrantsImmigrantsAfghanistanAfricaAlbaniaArgentinaArmeniaAustraliaAustriaBahamasBangladeshBarbadosBelarusBelgiumBelizeBoliviaBosnia and HerzegovinaBrazilBulgariaBurma/MyanmarCabo VerdeCambodiaCameroonCanadaCaribbeanCentral AmericaChileChinaColombiaCongoCosta RicaCroatiaCubaCzechoslovakiaDenmarkDominicaDominican RepublicEastern AfricaEastern AsiaEastern EuropeEcuadorEgyptEl SalvadorEnglandEritreaEthiopiaEuropeFijiFranceGermanyGhanaGreeceGrenadaGuatemalaGuyanaHaitiHondurasHong KongHungaryIndiaIndonesiaIranIraqIrelandIsraelItalyJamaicaJapanJordanKazakhstanKenyaKoreaKuwaitLaosLatin AmericaLatviaLebanonLiberiaLithuaniaMalaysiaMexicoMicronesiaMiddle AfricaMoldovaMoroccoNepalNetherlandsNicaraguaNigeriaNorth AmericaNorth MacedoniaNorthern AfricaNorthern EuropeNorwayOceaniaPakistanPanamaPeruPhilippinesPolandPortugalRomaniaRussiaSaudi ArabiaScotlandSenegalSerbiaSierra LeoneSingaporeSomaliaSouth AfricaSouth AmericaSouth Central AsiaSouth Eastern AsiaSouthern EuropeSpainSri LankaSt. Vincent and the GrenadinesSudanSwedenSwitzerlandSyriaTaiwanThailandTrinidad and TobagoTurkeyUgandaUkraineUruguayUzbekistanVenezuelaVietnamWest IndiesWestern AfricaWestern AsiaWestern EuropeYemenZaireZimbabweAzores
Disability Age 5 to 17
Income
Poverty
Unemployment
Labor Participation
Family Structure
Vehicle Availability
Education Level
Disability

Disability Age 5 to 17 Comparison

Immigrants from Asia

Immigrants from Ukraine

Exceptional
Exceptional
4.8%
DISABILITY AGE 5 TO 17
100.0/ 100
METRIC RATING
25th/ 347
METRIC RANK
5.1%
DISABILITY AGE 5 TO 17
99.9/ 100
METRIC RATING
58th/ 347
METRIC RANK

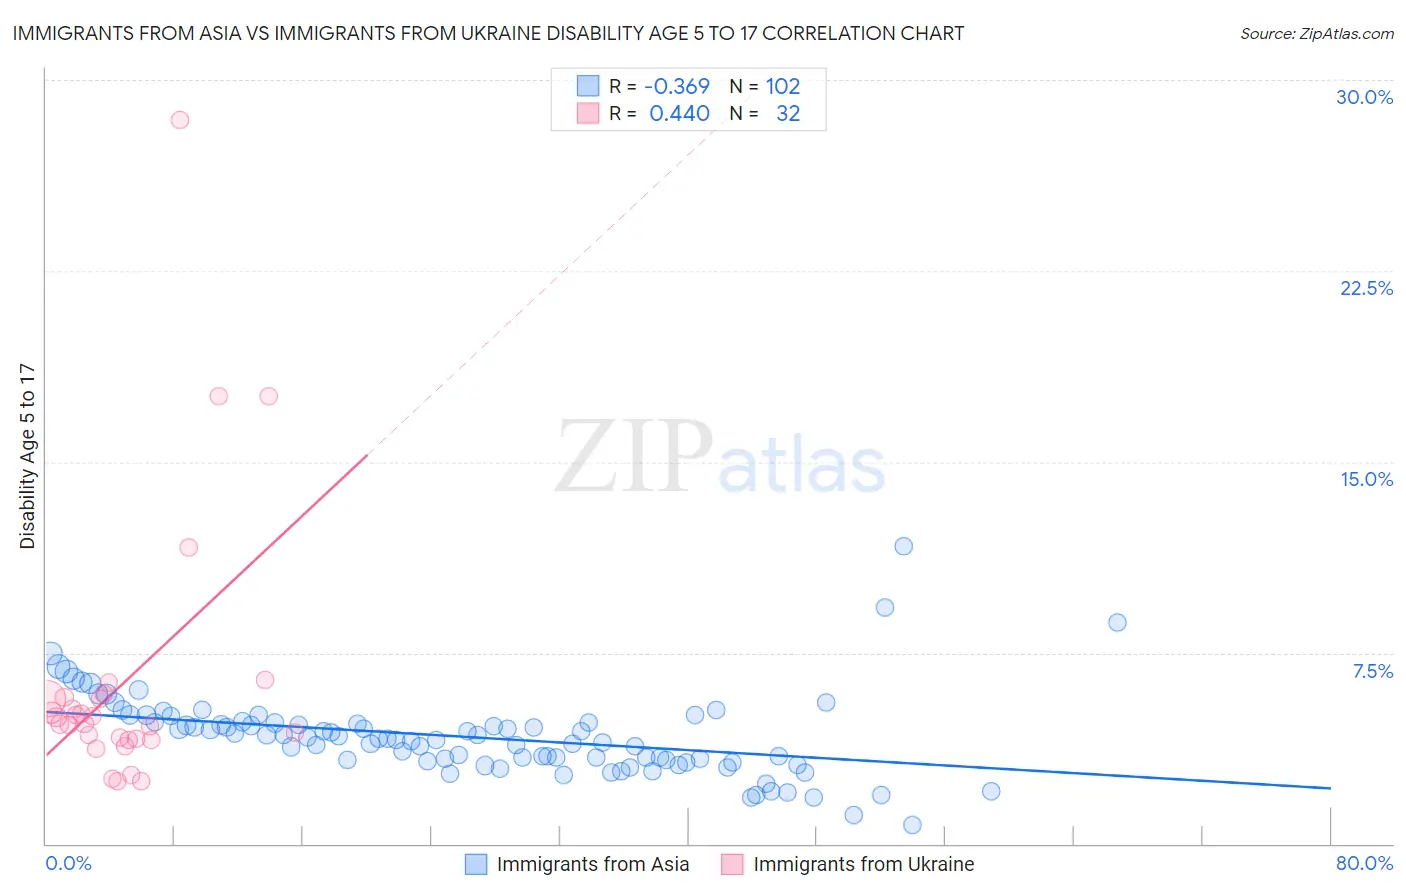
Immigrants from Asia vs Immigrants from Ukraine Disability Age 5 to 17 Correlation Chart

The statistical analysis conducted on geographies consisting of 539,214,409 people shows a mild negative correlation between the proportion of Immigrants from Asia and percentage of population with a disability between the ages 5 and 17 in the United States with a correlation coefficient (R) of -0.369 and weighted average of 4.8%. Similarly, the statistical analysis conducted on geographies consisting of 287,818,233 people shows a moderate positive correlation between the proportion of Immigrants from Ukraine and percentage of population with a disability between the ages 5 and 17 in the United States with a correlation coefficient (R) of 0.440 and weighted average of 5.1%, a difference of 5.7%.
Immigrants from Asia vs Immigrants from Ukraine Disability Age 5 to 17

Disability Age 5 to 17 Correlation Summary

MeasurementImmigrants from AsiaImmigrants from Ukraine
Minimum0.75%2.4%
Maximum11.7%28.4%
Range10.9%26.0%
Mean4.2%6.3%
Median4.1%4.9%
Interquartile 25% (IQ1)3.3%4.1%
Interquartile 75% (IQ3)4.8%5.7%
Interquartile Range (IQR)1.5%1.6%
Standard Deviation (Sample)1.6%5.4%
Standard Deviation (Population)1.6%5.3%

Similar Demographics by Disability Age 5 to 17

Demographics Similar to Immigrants from Asia by Disability Age 5 to 17

In terms of disability age 5 to 17, the demographic groups most similar to Immigrants from Asia are Immigrants from Lebanon (4.8%, a difference of 0.11%), Immigrants from Bolivia (4.8%, a difference of 0.26%), Bhutanese (4.9%, a difference of 0.87%), Asian (4.8%, a difference of 0.92%), and Yup'ik (4.8%, a difference of 1.3%).
DemographicsRating | RankDisability Age 5 to 17
Immigrants | South Central Asia
100.0
/100
|
#18
Exceptional
4.7%
Immigrants | Uzbekistan
100.0
/100
|
#19
Exceptional
4.8%
Burmese
100.0
/100
|
#20
Exceptional
4.8%
Yup'ik
100.0
/100
|
#21
Exceptional
4.8%
Asians
100.0
/100
|
#22
Exceptional
4.8%
Immigrants | Bolivia
100.0
/100
|
#23
Exceptional
4.8%
Immigrants | Lebanon
100.0
/100
|
#24
Exceptional
4.8%
Immigrants | Asia
100.0
/100
|
#25
Exceptional
4.8%
Bhutanese
100.0
/100
|
#26
Exceptional
4.9%
Taiwanese
100.0
/100
|
#27
Exceptional
4.9%
Immigrants | Japan
100.0
/100
|
#28
Exceptional
4.9%
Immigrants | Serbia
100.0
/100
|
#29
Exceptional
4.9%
Immigrants | Malaysia
100.0
/100
|
#30
Exceptional
5.0%
Immigrants | Pakistan
100.0
/100
|
#31
Exceptional
5.0%
Soviet Union
100.0
/100
|
#32
Exceptional
5.0%

Demographics Similar to Immigrants from Ukraine by Disability Age 5 to 17

In terms of disability age 5 to 17, the demographic groups most similar to Immigrants from Ukraine are Immigrants from Poland (5.1%, a difference of 0.090%), Immigrants from North Macedonia (5.1%, a difference of 0.18%), Immigrants from Turkey (5.1%, a difference of 0.23%), Laotian (5.1%, a difference of 0.24%), and Paraguayan (5.1%, a difference of 0.29%).
DemographicsRating | RankDisability Age 5 to 17
Turks
99.9
/100
|
#51
Exceptional
5.1%
Immigrants | Fiji
99.9
/100
|
#52
Exceptional
5.1%
Immigrants | Lithuania
99.9
/100
|
#53
Exceptional
5.1%
Paraguayans
99.9
/100
|
#54
Exceptional
5.1%
Laotians
99.9
/100
|
#55
Exceptional
5.1%
Immigrants | Turkey
99.9
/100
|
#56
Exceptional
5.1%
Immigrants | Poland
99.9
/100
|
#57
Exceptional
5.1%
Immigrants | Ukraine
99.9
/100
|
#58
Exceptional
5.1%
Immigrants | North Macedonia
99.9
/100
|
#59
Exceptional
5.1%
Immigrants | Eastern Europe
99.9
/100
|
#60
Exceptional
5.1%
Immigrants | Switzerland
99.8
/100
|
#61
Exceptional
5.2%
Immigrants | Ireland
99.8
/100
|
#62
Exceptional
5.2%
Immigrants | Bangladesh
99.8
/100
|
#63
Exceptional
5.2%
Immigrants | South Eastern Asia
99.8
/100
|
#64
Exceptional
5.2%
Immigrants | Greece
99.8
/100
|
#65
Exceptional
5.2%