Immigrants from Asia vs Immigrants from Thailand Unemployment Among Ages 65 to 74 years
COMPARE
Immigrants from Asia
Immigrants from Thailand
Unemployment Among Ages 65 to 74 years
Unemployment Among Ages 65 to 74 years Comparison
Immigrants from Asia
Immigrants from Thailand
5.3%
UNEMPLOYMENT AMONG AGES 65 TO 74 YEARS
78.4/ 100
METRIC RATING
141st/ 347
METRIC RANK
5.2%
UNEMPLOYMENT AMONG AGES 65 TO 74 YEARS
97.0/ 100
METRIC RATING
96th/ 347
METRIC RANK
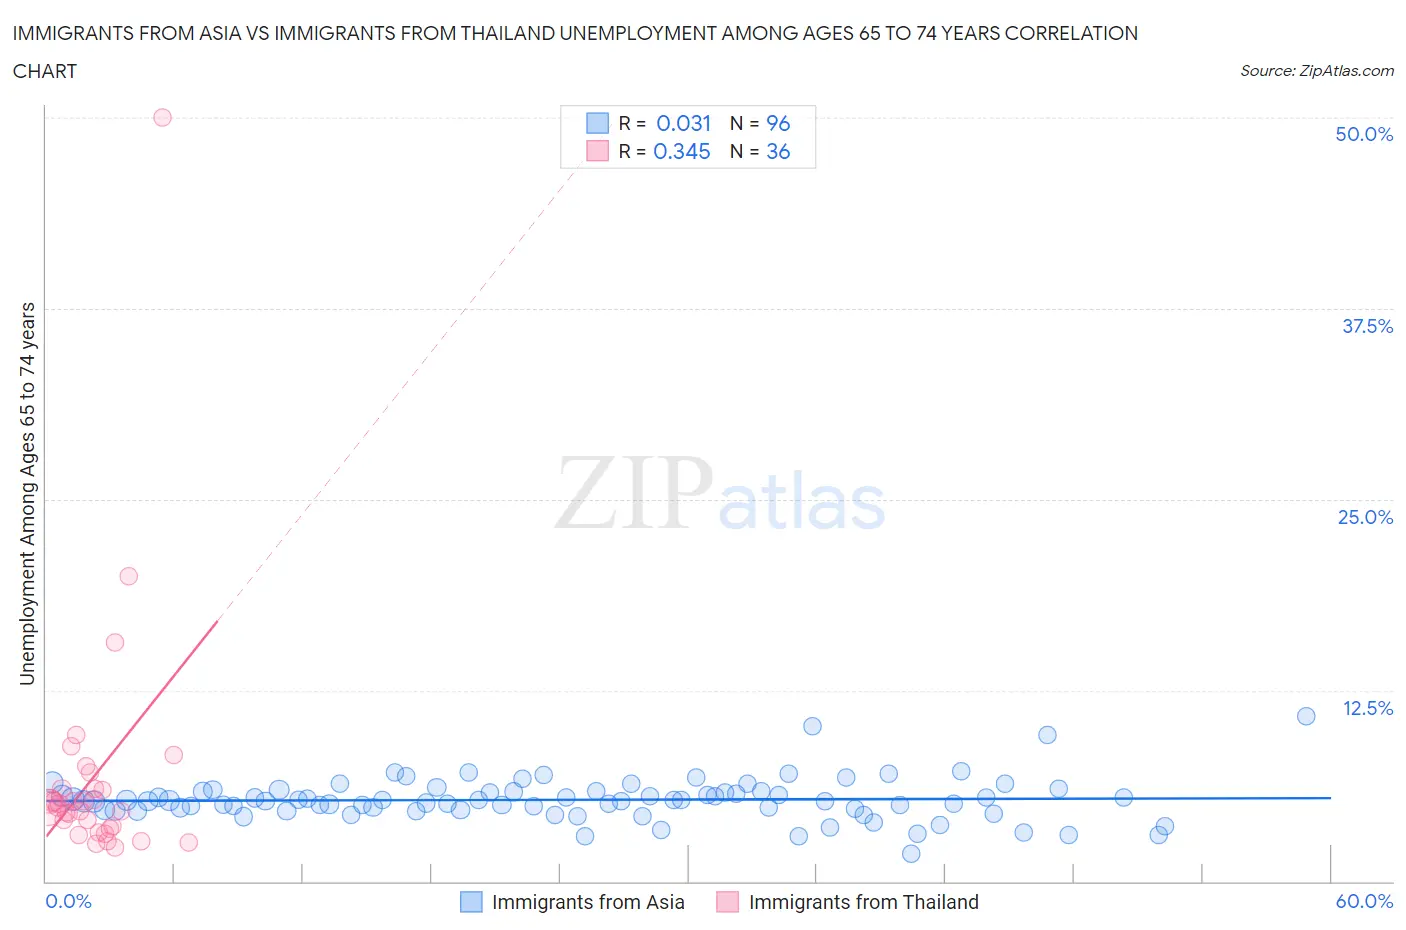
Immigrants from Asia vs Immigrants from Thailand Unemployment Among Ages 65 to 74 years Correlation Chart
The statistical analysis conducted on geographies consisting of 441,194,838 people shows no correlation between the proportion of Immigrants from Asia and unemployment rate among population between the ages 65 and 74 in the United States with a correlation coefficient (R) of 0.031 and weighted average of 5.3%. Similarly, the statistical analysis conducted on geographies consisting of 286,807,118 people shows a mild positive correlation between the proportion of Immigrants from Thailand and unemployment rate among population between the ages 65 and 74 in the United States with a correlation coefficient (R) of 0.345 and weighted average of 5.2%, a difference of 1.9%.
Unemployment Among Ages 65 to 74 years Correlation Summary
| Measurement | Immigrants from Asia | Immigrants from Thailand |
| Minimum | 1.8% | 2.2% |
| Maximum | 10.8% | 50.0% |
| Range | 9.0% | 47.8% |
| Mean | 5.3% | 6.8% |
| Median | 5.3% | 5.0% |
| Interquartile 25% (IQ1) | 4.7% | 3.5% |
| Interquartile 75% (IQ3) | 5.9% | 6.0% |
| Interquartile Range (IQR) | 1.2% | 2.5% |
| Standard Deviation (Sample) | 1.4% | 8.2% |
| Standard Deviation (Population) | 1.4% | 8.1% |
Similar Demographics by Unemployment Among Ages 65 to 74 years
Demographics Similar to Immigrants from Asia by Unemployment Among Ages 65 to 74 years
In terms of unemployment among ages 65 to 74 years, the demographic groups most similar to Immigrants from Asia are Immigrants from Laos (5.3%, a difference of 0.010%), Finnish (5.3%, a difference of 0.030%), Chilean (5.3%, a difference of 0.070%), Turkish (5.3%, a difference of 0.11%), and New Zealander (5.3%, a difference of 0.11%).
| Demographics | Rating | Rank | Unemployment Among Ages 65 to 74 years |
| Immigrants | Panama | 81.8 /100 | #134 | Excellent 5.3% |
| Immigrants | Serbia | 81.8 /100 | #135 | Excellent 5.3% |
| Celtics | 80.8 /100 | #136 | Excellent 5.3% |
| Immigrants | Afghanistan | 80.8 /100 | #137 | Excellent 5.3% |
| Chileans | 79.7 /100 | #138 | Good 5.3% |
| Finns | 79.0 /100 | #139 | Good 5.3% |
| Immigrants | Laos | 78.6 /100 | #140 | Good 5.3% |
| Immigrants | Asia | 78.4 /100 | #141 | Good 5.3% |
| Turks | 76.2 /100 | #142 | Good 5.3% |
| New Zealanders | 76.1 /100 | #143 | Good 5.3% |
| Immigrants | Chile | 76.0 /100 | #144 | Good 5.3% |
| Canadians | 75.0 /100 | #145 | Good 5.3% |
| Irish | 74.8 /100 | #146 | Good 5.3% |
| Immigrants | Latvia | 74.6 /100 | #147 | Good 5.3% |
| Immigrants | Sri Lanka | 73.8 /100 | #148 | Good 5.3% |
Demographics Similar to Immigrants from Thailand by Unemployment Among Ages 65 to 74 years
In terms of unemployment among ages 65 to 74 years, the demographic groups most similar to Immigrants from Thailand are Serbian (5.2%, a difference of 0.020%), South African (5.2%, a difference of 0.030%), Immigrants from Netherlands (5.2%, a difference of 0.050%), Puget Sound Salish (5.2%, a difference of 0.10%), and Senegalese (5.2%, a difference of 0.12%).
| Demographics | Rating | Rank | Unemployment Among Ages 65 to 74 years |
| English | 97.8 /100 | #89 | Exceptional 5.2% |
| Luxembourgers | 97.6 /100 | #90 | Exceptional 5.2% |
| Romanians | 97.4 /100 | #91 | Exceptional 5.2% |
| Puget Sound Salish | 97.3 /100 | #92 | Exceptional 5.2% |
| Immigrants | Netherlands | 97.1 /100 | #93 | Exceptional 5.2% |
| South Africans | 97.1 /100 | #94 | Exceptional 5.2% |
| Serbians | 97.0 /100 | #95 | Exceptional 5.2% |
| Immigrants | Thailand | 97.0 /100 | #96 | Exceptional 5.2% |
| Senegalese | 96.5 /100 | #97 | Exceptional 5.2% |
| Welsh | 96.5 /100 | #98 | Exceptional 5.2% |
| Burmese | 96.4 /100 | #99 | Exceptional 5.2% |
| Japanese | 96.4 /100 | #100 | Exceptional 5.2% |
| Immigrants | Cambodia | 96.3 /100 | #101 | Exceptional 5.2% |
| Immigrants | Lithuania | 95.9 /100 | #102 | Exceptional 5.2% |
| Immigrants | Vietnam | 95.6 /100 | #103 | Exceptional 5.2% |