Immigrants from Asia vs Finnish Female Disability
COMPARE
Immigrants from Asia
Finnish
Female Disability
Female Disability Comparison
Immigrants from Asia
Finns
11.0%
FEMALE DISABILITY
100.0/ 100
METRIC RATING
25th/ 347
METRIC RANK
12.8%
FEMALE DISABILITY
0.4/ 100
METRIC RATING
266th/ 347
METRIC RANK
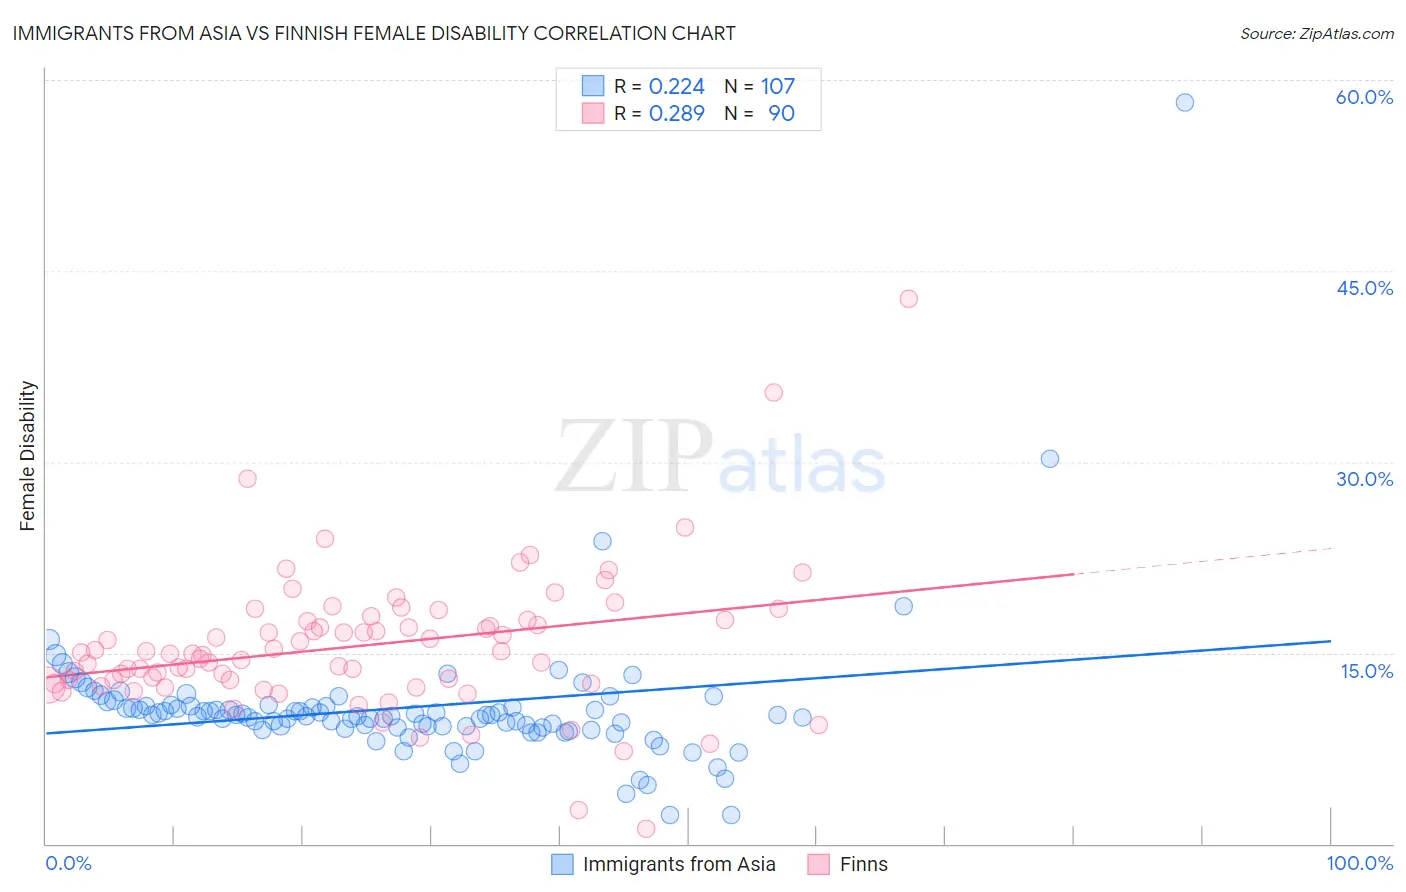
Immigrants from Asia vs Finnish Female Disability Correlation Chart
The statistical analysis conducted on geographies consisting of 548,970,010 people shows a weak positive correlation between the proportion of Immigrants from Asia and percentage of females with a disability in the United States with a correlation coefficient (R) of 0.224 and weighted average of 11.0%. Similarly, the statistical analysis conducted on geographies consisting of 404,612,195 people shows a weak positive correlation between the proportion of Finns and percentage of females with a disability in the United States with a correlation coefficient (R) of 0.289 and weighted average of 12.8%, a difference of 16.4%.
Female Disability Correlation Summary
| Measurement | Immigrants from Asia | Finnish |
| Minimum | 2.2% | 1.2% |
| Maximum | 58.2% | 42.9% |
| Range | 56.0% | 41.7% |
| Mean | 10.7% | 15.5% |
| Median | 10.1% | 15.0% |
| Interquartile 25% (IQ1) | 9.2% | 12.6% |
| Interquartile 75% (IQ3) | 10.8% | 17.5% |
| Interquartile Range (IQR) | 1.7% | 5.0% |
| Standard Deviation (Sample) | 5.7% | 5.6% |
| Standard Deviation (Population) | 5.7% | 5.6% |
Similar Demographics by Female Disability
Demographics Similar to Immigrants from Asia by Female Disability
In terms of female disability, the demographic groups most similar to Immigrants from Asia are Immigrants from Argentina (11.0%, a difference of 0.030%), Argentinean (11.0%, a difference of 0.040%), Immigrants from Turkey (11.1%, a difference of 0.44%), Venezuelan (11.0%, a difference of 0.59%), and Egyptian (11.1%, a difference of 0.72%).
| Demographics | Rating | Rank | Female Disability |
| Immigrants | Iran | 100.0 /100 | #18 | Exceptional 10.8% |
| Immigrants | Venezuela | 100.0 /100 | #19 | Exceptional 10.9% |
| Immigrants | Pakistan | 100.0 /100 | #20 | Exceptional 10.9% |
| Asians | 100.0 /100 | #21 | Exceptional 10.9% |
| Immigrants | Sri Lanka | 100.0 /100 | #22 | Exceptional 10.9% |
| Venezuelans | 100.0 /100 | #23 | Exceptional 11.0% |
| Immigrants | Argentina | 100.0 /100 | #24 | Exceptional 11.0% |
| Immigrants | Asia | 100.0 /100 | #25 | Exceptional 11.0% |
| Argentineans | 100.0 /100 | #26 | Exceptional 11.0% |
| Immigrants | Turkey | 100.0 /100 | #27 | Exceptional 11.1% |
| Egyptians | 100.0 /100 | #28 | Exceptional 11.1% |
| Immigrants | Malaysia | 100.0 /100 | #29 | Exceptional 11.1% |
| Turks | 100.0 /100 | #30 | Exceptional 11.1% |
| Immigrants | Kuwait | 100.0 /100 | #31 | Exceptional 11.1% |
| Immigrants | Australia | 100.0 /100 | #32 | Exceptional 11.1% |
Demographics Similar to Finns by Female Disability
In terms of female disability, the demographic groups most similar to Finns are Senegalese (12.8%, a difference of 0.020%), Immigrants from Laos (12.8%, a difference of 0.040%), Indonesian (12.8%, a difference of 0.10%), West Indian (12.8%, a difference of 0.12%), and Immigrants from Liberia (12.9%, a difference of 0.28%).
| Demographics | Rating | Rank | Female Disability |
| Immigrants | Armenia | 1.0 /100 | #259 | Tragic 12.7% |
| Sub-Saharan Africans | 1.0 /100 | #260 | Tragic 12.7% |
| Bermudans | 1.0 /100 | #261 | Tragic 12.7% |
| Czechoslovakians | 0.9 /100 | #262 | Tragic 12.7% |
| Spaniards | 0.7 /100 | #263 | Tragic 12.8% |
| Alaska Natives | 0.6 /100 | #264 | Tragic 12.8% |
| West Indians | 0.5 /100 | #265 | Tragic 12.8% |
| Finns | 0.4 /100 | #266 | Tragic 12.8% |
| Senegalese | 0.4 /100 | #267 | Tragic 12.8% |
| Immigrants | Laos | 0.4 /100 | #268 | Tragic 12.8% |
| Indonesians | 0.4 /100 | #269 | Tragic 12.8% |
| Immigrants | Liberia | 0.3 /100 | #270 | Tragic 12.9% |
| Dutch | 0.2 /100 | #271 | Tragic 12.9% |
| Germans | 0.1 /100 | #272 | Tragic 12.9% |
| Sioux | 0.1 /100 | #273 | Tragic 12.9% |