Hispanic or Latino vs Finnish Female Disability
COMPARE
Hispanic or Latino
Finnish
Female Disability
Female Disability Comparison
Hispanics or Latinos
Finns
12.5%
FEMALE DISABILITY
8.0/ 100
METRIC RATING
226th/ 347
METRIC RANK
12.8%
FEMALE DISABILITY
0.4/ 100
METRIC RATING
266th/ 347
METRIC RANK
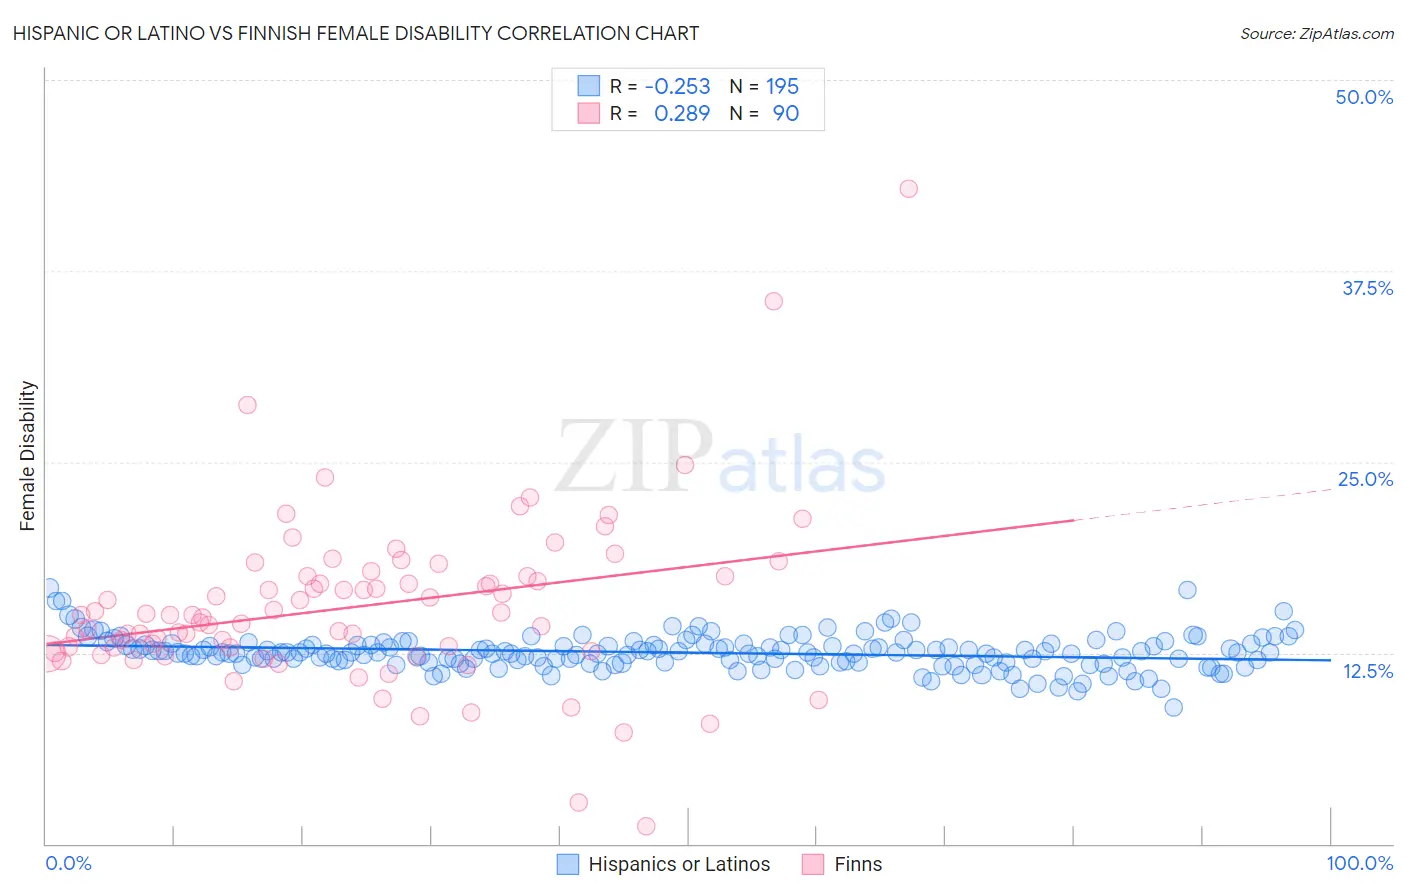
Hispanic or Latino vs Finnish Female Disability Correlation Chart
The statistical analysis conducted on geographies consisting of 572,741,012 people shows a weak negative correlation between the proportion of Hispanics or Latinos and percentage of females with a disability in the United States with a correlation coefficient (R) of -0.253 and weighted average of 12.5%. Similarly, the statistical analysis conducted on geographies consisting of 404,612,195 people shows a weak positive correlation between the proportion of Finns and percentage of females with a disability in the United States with a correlation coefficient (R) of 0.289 and weighted average of 12.8%, a difference of 2.8%.
Female Disability Correlation Summary
| Measurement | Hispanic or Latino | Finnish |
| Minimum | 8.9% | 1.2% |
| Maximum | 16.7% | 42.9% |
| Range | 7.8% | 41.7% |
| Mean | 12.5% | 15.5% |
| Median | 12.5% | 15.0% |
| Interquartile 25% (IQ1) | 11.9% | 12.6% |
| Interquartile 75% (IQ3) | 13.1% | 17.5% |
| Interquartile Range (IQR) | 1.2% | 5.0% |
| Standard Deviation (Sample) | 1.1% | 5.6% |
| Standard Deviation (Population) | 1.1% | 5.6% |
Similar Demographics by Female Disability
Demographics Similar to Hispanics or Latinos by Female Disability
In terms of female disability, the demographic groups most similar to Hispanics or Latinos are Assyrian/Chaldean/Syriac (12.5%, a difference of 0.010%), Immigrants from Cambodia (12.5%, a difference of 0.030%), Polish (12.5%, a difference of 0.050%), Hungarian (12.5%, a difference of 0.11%), and Immigrants from Belize (12.5%, a difference of 0.14%).
| Demographics | Rating | Rank | Female Disability |
| Europeans | 12.1 /100 | #219 | Poor 12.4% |
| Bahamians | 11.1 /100 | #220 | Poor 12.4% |
| Native Hawaiians | 10.8 /100 | #221 | Poor 12.4% |
| Italians | 10.7 /100 | #222 | Poor 12.4% |
| Guamanians/Chamorros | 9.5 /100 | #223 | Tragic 12.5% |
| Belizeans | 9.3 /100 | #224 | Tragic 12.5% |
| Poles | 8.4 /100 | #225 | Tragic 12.5% |
| Hispanics or Latinos | 8.0 /100 | #226 | Tragic 12.5% |
| Assyrians/Chaldeans/Syriacs | 8.0 /100 | #227 | Tragic 12.5% |
| Immigrants | Cambodia | 7.8 /100 | #228 | Tragic 12.5% |
| Hungarians | 7.2 /100 | #229 | Tragic 12.5% |
| Immigrants | Belize | 7.0 /100 | #230 | Tragic 12.5% |
| Belgians | 6.5 /100 | #231 | Tragic 12.5% |
| Immigrants | Somalia | 5.9 /100 | #232 | Tragic 12.5% |
| Immigrants | Iraq | 5.3 /100 | #233 | Tragic 12.5% |
Demographics Similar to Finns by Female Disability
In terms of female disability, the demographic groups most similar to Finns are Senegalese (12.8%, a difference of 0.020%), Immigrants from Laos (12.8%, a difference of 0.040%), Indonesian (12.8%, a difference of 0.10%), West Indian (12.8%, a difference of 0.12%), and Immigrants from Liberia (12.9%, a difference of 0.28%).
| Demographics | Rating | Rank | Female Disability |
| Immigrants | Armenia | 1.0 /100 | #259 | Tragic 12.7% |
| Sub-Saharan Africans | 1.0 /100 | #260 | Tragic 12.7% |
| Bermudans | 1.0 /100 | #261 | Tragic 12.7% |
| Czechoslovakians | 0.9 /100 | #262 | Tragic 12.7% |
| Spaniards | 0.7 /100 | #263 | Tragic 12.8% |
| Alaska Natives | 0.6 /100 | #264 | Tragic 12.8% |
| West Indians | 0.5 /100 | #265 | Tragic 12.8% |
| Finns | 0.4 /100 | #266 | Tragic 12.8% |
| Senegalese | 0.4 /100 | #267 | Tragic 12.8% |
| Immigrants | Laos | 0.4 /100 | #268 | Tragic 12.8% |
| Indonesians | 0.4 /100 | #269 | Tragic 12.8% |
| Immigrants | Liberia | 0.3 /100 | #270 | Tragic 12.9% |
| Dutch | 0.2 /100 | #271 | Tragic 12.9% |
| Germans | 0.1 /100 | #272 | Tragic 12.9% |
| Sioux | 0.1 /100 | #273 | Tragic 12.9% |