Immigrants from Asia vs Finnish Unemployment Among Ages 45 to 54 years
COMPARE
Immigrants from Asia
Finnish
Unemployment Among Ages 45 to 54 years
Unemployment Among Ages 45 to 54 years Comparison
Immigrants from Asia
Finns
4.4%
UNEMPLOYMENT AMONG AGES 45 TO 54 YEARS
88.8/ 100
METRIC RATING
123rd/ 347
METRIC RANK
4.2%
UNEMPLOYMENT AMONG AGES 45 TO 54 YEARS
99.6/ 100
METRIC RATING
48th/ 347
METRIC RANK
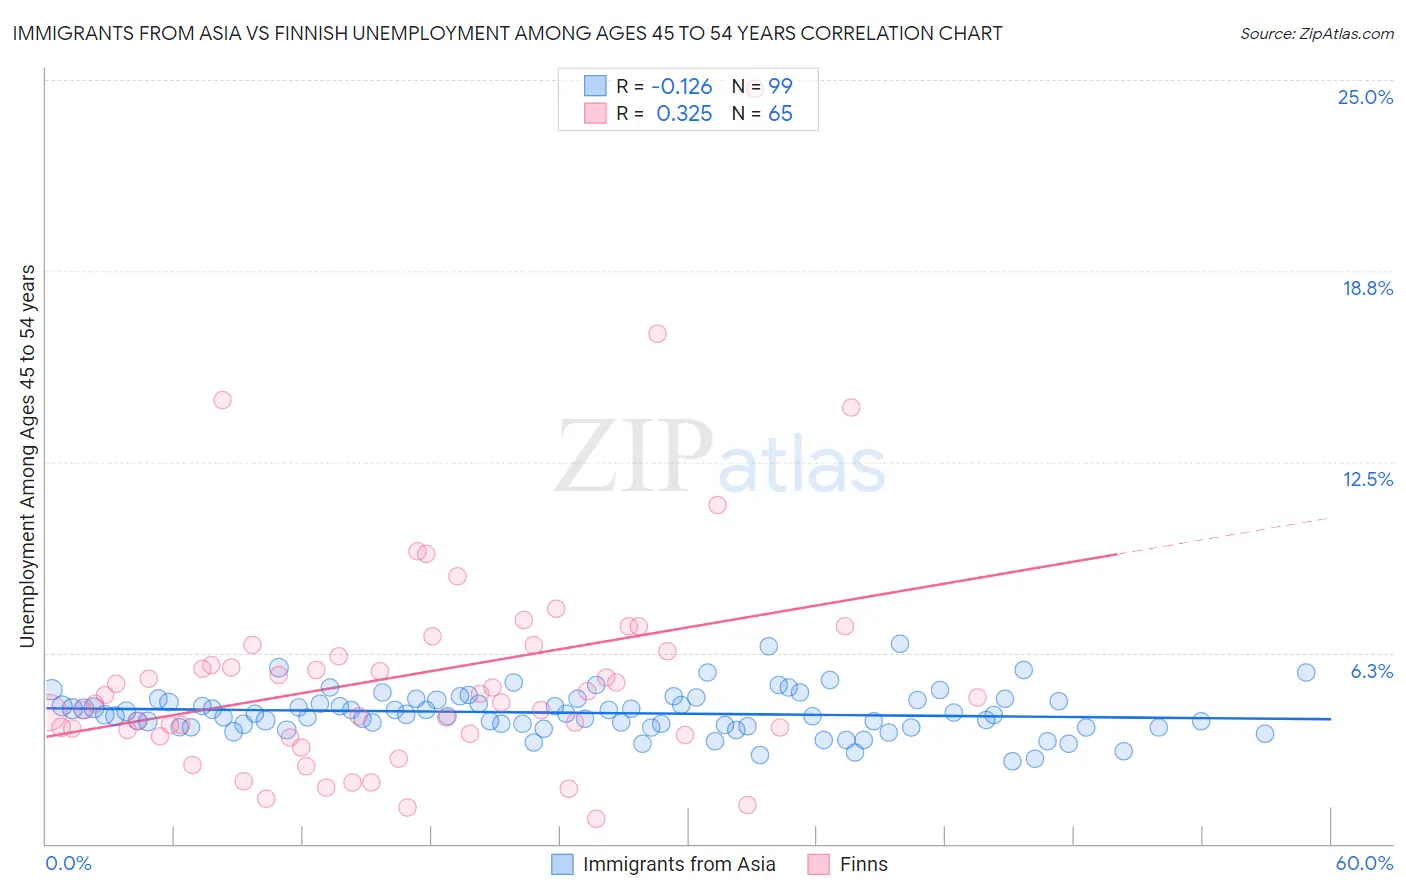
Immigrants from Asia vs Finnish Unemployment Among Ages 45 to 54 years Correlation Chart
The statistical analysis conducted on geographies consisting of 517,041,260 people shows a poor negative correlation between the proportion of Immigrants from Asia and unemployment rate among population between the ages 45 and 54 in the United States with a correlation coefficient (R) of -0.126 and weighted average of 4.4%. Similarly, the statistical analysis conducted on geographies consisting of 390,310,667 people shows a mild positive correlation between the proportion of Finns and unemployment rate among population between the ages 45 and 54 in the United States with a correlation coefficient (R) of 0.325 and weighted average of 4.2%, a difference of 4.3%.
Unemployment Among Ages 45 to 54 years Correlation Summary
| Measurement | Immigrants from Asia | Finnish |
| Minimum | 2.7% | 0.80% |
| Maximum | 6.6% | 24.7% |
| Range | 3.9% | 23.9% |
| Mean | 4.3% | 5.5% |
| Median | 4.2% | 4.8% |
| Interquartile 25% (IQ1) | 3.8% | 3.6% |
| Interquartile 75% (IQ3) | 4.7% | 6.4% |
| Interquartile Range (IQR) | 0.88% | 2.8% |
| Standard Deviation (Sample) | 0.72% | 3.9% |
| Standard Deviation (Population) | 0.71% | 3.9% |
Similar Demographics by Unemployment Among Ages 45 to 54 years
Demographics Similar to Immigrants from Asia by Unemployment Among Ages 45 to 54 years
In terms of unemployment among ages 45 to 54 years, the demographic groups most similar to Immigrants from Asia are Spanish (4.4%, a difference of 0.0%), Immigrants from Vietnam (4.4%, a difference of 0.020%), Immigrants from Oceania (4.4%, a difference of 0.090%), Immigrants from Kazakhstan (4.4%, a difference of 0.090%), and American (4.4%, a difference of 0.10%).
| Demographics | Rating | Rank | Unemployment Among Ages 45 to 54 years |
| Immigrants | North Macedonia | 90.6 /100 | #116 | Exceptional 4.4% |
| South Africans | 90.4 /100 | #117 | Exceptional 4.4% |
| Immigrants | Romania | 90.0 /100 | #118 | Exceptional 4.4% |
| Native Hawaiians | 90.0 /100 | #119 | Excellent 4.4% |
| Americans | 89.6 /100 | #120 | Excellent 4.4% |
| Immigrants | Oceania | 89.5 /100 | #121 | Excellent 4.4% |
| Immigrants | Kazakhstan | 89.5 /100 | #122 | Excellent 4.4% |
| Immigrants | Asia | 88.8 /100 | #123 | Excellent 4.4% |
| Spanish | 88.8 /100 | #124 | Excellent 4.4% |
| Immigrants | Vietnam | 88.6 /100 | #125 | Excellent 4.4% |
| Immigrants | Czechoslovakia | 87.8 /100 | #126 | Excellent 4.4% |
| Nicaraguans | 87.6 /100 | #127 | Excellent 4.4% |
| Immigrants | Northern Europe | 86.9 /100 | #128 | Excellent 4.4% |
| Laotians | 86.3 /100 | #129 | Excellent 4.4% |
| Celtics | 86.2 /100 | #130 | Excellent 4.4% |
Demographics Similar to Finns by Unemployment Among Ages 45 to 54 years
In terms of unemployment among ages 45 to 54 years, the demographic groups most similar to Finns are Immigrants from Zimbabwe (4.2%, a difference of 0.040%), Basque (4.2%, a difference of 0.040%), Burmese (4.2%, a difference of 0.050%), Filipino (4.2%, a difference of 0.070%), and Luxembourger (4.2%, a difference of 0.080%).
| Demographics | Rating | Rank | Unemployment Among Ages 45 to 54 years |
| Czechoslovakians | 99.8 /100 | #41 | Exceptional 4.2% |
| Immigrants | Scotland | 99.8 /100 | #42 | Exceptional 4.2% |
| Zimbabweans | 99.8 /100 | #43 | Exceptional 4.2% |
| Immigrants | Singapore | 99.7 /100 | #44 | Exceptional 4.2% |
| Immigrants | Bulgaria | 99.7 /100 | #45 | Exceptional 4.2% |
| Luxembourgers | 99.6 /100 | #46 | Exceptional 4.2% |
| Filipinos | 99.6 /100 | #47 | Exceptional 4.2% |
| Finns | 99.6 /100 | #48 | Exceptional 4.2% |
| Immigrants | Zimbabwe | 99.6 /100 | #49 | Exceptional 4.2% |
| Basques | 99.6 /100 | #50 | Exceptional 4.2% |
| Burmese | 99.6 /100 | #51 | Exceptional 4.2% |
| Poles | 99.5 /100 | #52 | Exceptional 4.2% |
| Irish | 99.5 /100 | #53 | Exceptional 4.2% |
| Chickasaw | 99.5 /100 | #54 | Exceptional 4.2% |
| Latvians | 99.4 /100 | #55 | Exceptional 4.2% |