Immigrants from Africa vs Immigrants from Venezuela Disability Age Under 5
COMPARE
Immigrants from Africa
Immigrants from Venezuela
Disability Age Under 5
Disability Age Under 5 Comparison
Immigrants from Africa
Immigrants from Venezuela
1.2%
DISABILITY AGE UNDER 5
65.1/ 100
METRIC RATING
161st/ 347
METRIC RANK
1.2%
DISABILITY AGE UNDER 5
93.4/ 100
METRIC RATING
118th/ 347
METRIC RANK
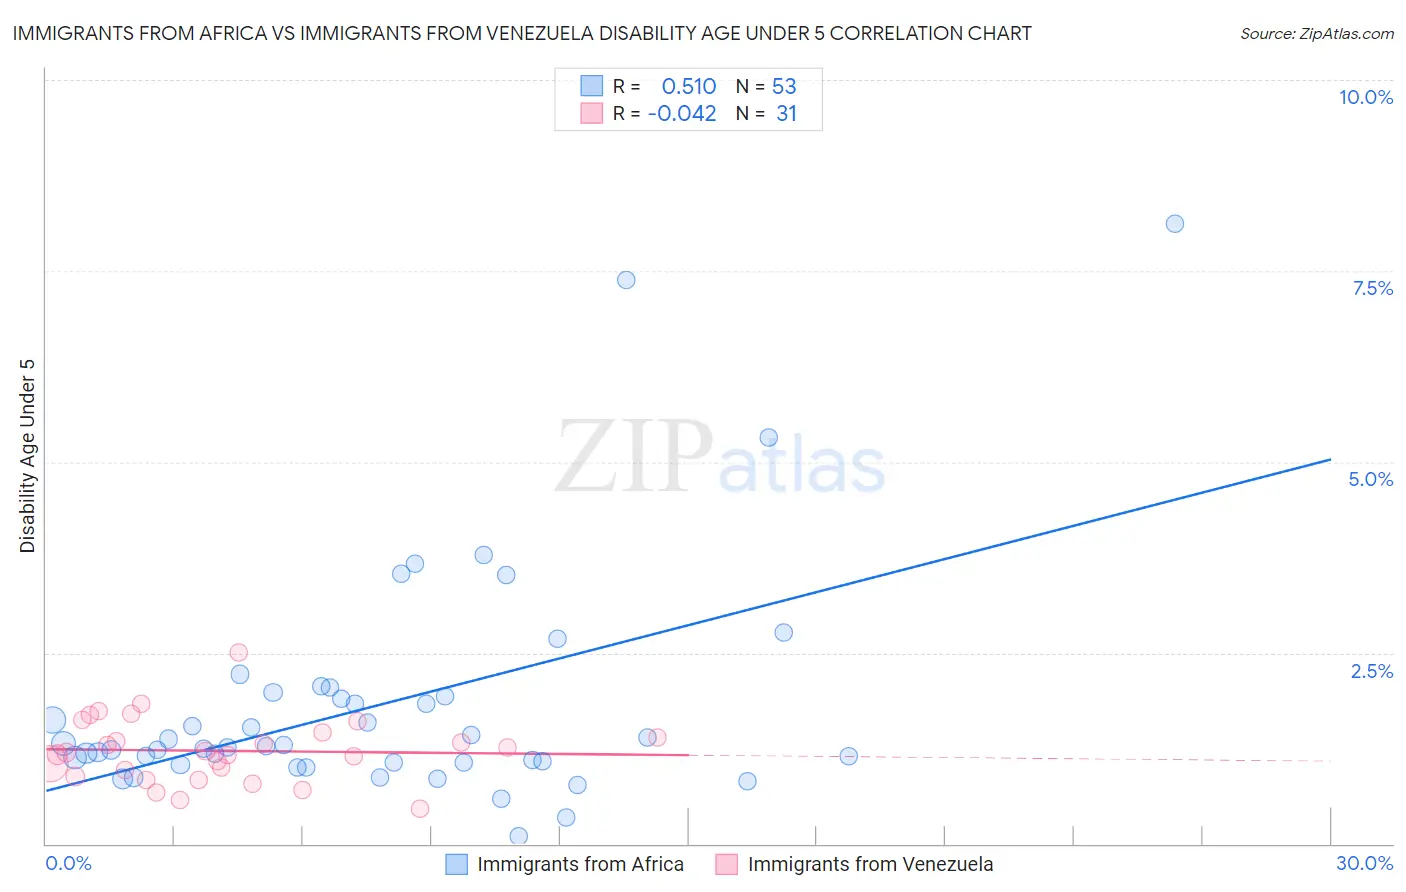
Immigrants from Africa vs Immigrants from Venezuela Disability Age Under 5 Correlation Chart
The statistical analysis conducted on geographies consisting of 240,976,621 people shows a substantial positive correlation between the proportion of Immigrants from Africa and percentage of population with a disability under the age of 5 in the United States with a correlation coefficient (R) of 0.510 and weighted average of 1.2%. Similarly, the statistical analysis conducted on geographies consisting of 173,759,637 people shows no correlation between the proportion of Immigrants from Venezuela and percentage of population with a disability under the age of 5 in the United States with a correlation coefficient (R) of -0.042 and weighted average of 1.2%, a difference of 4.9%.
Disability Age Under 5 Correlation Summary
| Measurement | Immigrants from Africa | Immigrants from Venezuela |
| Minimum | 0.10% | 0.46% |
| Maximum | 8.1% | 2.5% |
| Range | 8.0% | 2.0% |
| Mean | 1.8% | 1.2% |
| Median | 1.3% | 1.2% |
| Interquartile 25% (IQ1) | 1.1% | 0.88% |
| Interquartile 75% (IQ3) | 2.0% | 1.4% |
| Interquartile Range (IQR) | 0.89% | 0.57% |
| Standard Deviation (Sample) | 1.5% | 0.43% |
| Standard Deviation (Population) | 1.5% | 0.42% |
Similar Demographics by Disability Age Under 5
Demographics Similar to Immigrants from Africa by Disability Age Under 5
In terms of disability age under 5, the demographic groups most similar to Immigrants from Africa are Colombian (1.2%, a difference of 0.070%), Immigrants from Latin America (1.2%, a difference of 0.070%), Arab (1.2%, a difference of 0.13%), Guatemalan (1.2%, a difference of 0.15%), and Immigrants from South America (1.2%, a difference of 0.19%).
| Demographics | Rating | Rank | Disability Age Under 5 |
| Uruguayans | 68.8 /100 | #154 | Good 1.2% |
| Immigrants | Ghana | 68.7 /100 | #155 | Good 1.2% |
| Hawaiians | 68.5 /100 | #156 | Good 1.2% |
| Immigrants | South America | 67.0 /100 | #157 | Good 1.2% |
| Arabs | 66.4 /100 | #158 | Good 1.2% |
| Colombians | 65.8 /100 | #159 | Good 1.2% |
| Immigrants | Latin America | 65.8 /100 | #160 | Good 1.2% |
| Immigrants | Africa | 65.1 /100 | #161 | Good 1.2% |
| Guatemalans | 63.6 /100 | #162 | Good 1.2% |
| Immigrants | Guatemala | 63.2 /100 | #163 | Good 1.2% |
| Laotians | 62.8 /100 | #164 | Good 1.2% |
| Immigrants | Kuwait | 62.6 /100 | #165 | Good 1.2% |
| Immigrants | Central America | 61.4 /100 | #166 | Good 1.2% |
| Immigrants | Argentina | 60.2 /100 | #167 | Good 1.2% |
| Sierra Leoneans | 59.1 /100 | #168 | Average 1.2% |
Demographics Similar to Immigrants from Venezuela by Disability Age Under 5
In terms of disability age under 5, the demographic groups most similar to Immigrants from Venezuela are Immigrants from Philippines (1.2%, a difference of 0.030%), Immigrants from Northern Africa (1.2%, a difference of 0.17%), Immigrants from Caribbean (1.2%, a difference of 0.19%), Belizean (1.2%, a difference of 0.20%), and Bhutanese (1.2%, a difference of 0.34%).
| Demographics | Rating | Rank | Disability Age Under 5 |
| Senegalese | 94.6 /100 | #111 | Exceptional 1.2% |
| Immigrants | Australia | 94.4 /100 | #112 | Exceptional 1.2% |
| Immigrants | Oceania | 94.2 /100 | #113 | Exceptional 1.2% |
| Belizeans | 93.9 /100 | #114 | Exceptional 1.2% |
| Immigrants | Caribbean | 93.8 /100 | #115 | Exceptional 1.2% |
| Immigrants | Northern Africa | 93.8 /100 | #116 | Exceptional 1.2% |
| Immigrants | Philippines | 93.5 /100 | #117 | Exceptional 1.2% |
| Immigrants | Venezuela | 93.4 /100 | #118 | Exceptional 1.2% |
| Bhutanese | 92.5 /100 | #119 | Exceptional 1.2% |
| Immigrants | Eritrea | 92.3 /100 | #120 | Exceptional 1.2% |
| Immigrants | Senegal | 91.4 /100 | #121 | Exceptional 1.2% |
| Aleuts | 90.7 /100 | #122 | Exceptional 1.2% |
| Zimbabweans | 90.6 /100 | #123 | Exceptional 1.2% |
| Immigrants | Cambodia | 90.5 /100 | #124 | Exceptional 1.2% |
| Japanese | 90.3 /100 | #125 | Exceptional 1.2% |