Immigrants from Africa vs Ethiopian Disability Age Under 5
COMPARE
Immigrants from Africa
Ethiopian
Disability Age Under 5
Disability Age Under 5 Comparison
Immigrants from Africa
Ethiopians
1.2%
DISABILITY AGE UNDER 5
65.1/ 100
METRIC RATING
161st/ 347
METRIC RANK
1.1%
DISABILITY AGE UNDER 5
97.2/ 100
METRIC RATING
89th/ 347
METRIC RANK
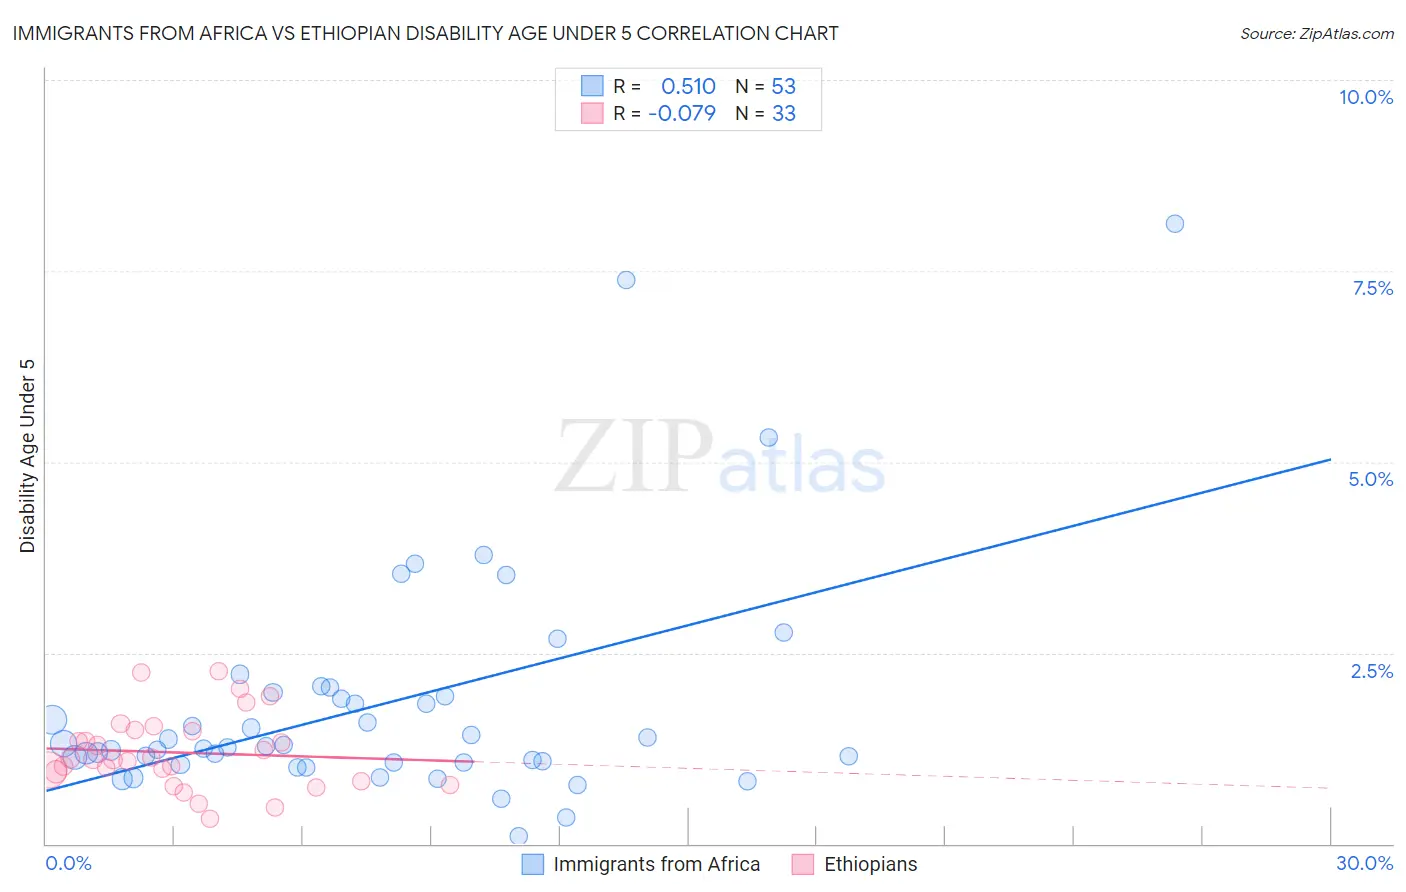
Immigrants from Africa vs Ethiopian Disability Age Under 5 Correlation Chart
The statistical analysis conducted on geographies consisting of 240,976,621 people shows a substantial positive correlation between the proportion of Immigrants from Africa and percentage of population with a disability under the age of 5 in the United States with a correlation coefficient (R) of 0.510 and weighted average of 1.2%. Similarly, the statistical analysis conducted on geographies consisting of 145,731,727 people shows a slight negative correlation between the proportion of Ethiopians and percentage of population with a disability under the age of 5 in the United States with a correlation coefficient (R) of -0.079 and weighted average of 1.1%, a difference of 7.2%.
Disability Age Under 5 Correlation Summary
| Measurement | Immigrants from Africa | Ethiopian |
| Minimum | 0.10% | 0.34% |
| Maximum | 8.1% | 2.3% |
| Range | 8.0% | 1.9% |
| Mean | 1.8% | 1.2% |
| Median | 1.3% | 1.1% |
| Interquartile 25% (IQ1) | 1.1% | 0.88% |
| Interquartile 75% (IQ3) | 2.0% | 1.5% |
| Interquartile Range (IQR) | 0.89% | 0.60% |
| Standard Deviation (Sample) | 1.5% | 0.48% |
| Standard Deviation (Population) | 1.5% | 0.47% |
Similar Demographics by Disability Age Under 5
Demographics Similar to Immigrants from Africa by Disability Age Under 5
In terms of disability age under 5, the demographic groups most similar to Immigrants from Africa are Colombian (1.2%, a difference of 0.070%), Immigrants from Latin America (1.2%, a difference of 0.070%), Arab (1.2%, a difference of 0.13%), Guatemalan (1.2%, a difference of 0.15%), and Immigrants from South America (1.2%, a difference of 0.19%).
| Demographics | Rating | Rank | Disability Age Under 5 |
| Uruguayans | 68.8 /100 | #154 | Good 1.2% |
| Immigrants | Ghana | 68.7 /100 | #155 | Good 1.2% |
| Hawaiians | 68.5 /100 | #156 | Good 1.2% |
| Immigrants | South America | 67.0 /100 | #157 | Good 1.2% |
| Arabs | 66.4 /100 | #158 | Good 1.2% |
| Colombians | 65.8 /100 | #159 | Good 1.2% |
| Immigrants | Latin America | 65.8 /100 | #160 | Good 1.2% |
| Immigrants | Africa | 65.1 /100 | #161 | Good 1.2% |
| Guatemalans | 63.6 /100 | #162 | Good 1.2% |
| Immigrants | Guatemala | 63.2 /100 | #163 | Good 1.2% |
| Laotians | 62.8 /100 | #164 | Good 1.2% |
| Immigrants | Kuwait | 62.6 /100 | #165 | Good 1.2% |
| Immigrants | Central America | 61.4 /100 | #166 | Good 1.2% |
| Immigrants | Argentina | 60.2 /100 | #167 | Good 1.2% |
| Sierra Leoneans | 59.1 /100 | #168 | Average 1.2% |
Demographics Similar to Ethiopians by Disability Age Under 5
In terms of disability age under 5, the demographic groups most similar to Ethiopians are Chinese (1.1%, a difference of 0.030%), Albanian (1.1%, a difference of 0.070%), Immigrants from Cuba (1.1%, a difference of 0.24%), Spanish American (1.1%, a difference of 0.27%), and Immigrants from Dominican Republic (1.1%, a difference of 0.28%).
| Demographics | Rating | Rank | Disability Age Under 5 |
| Immigrants | Jordan | 97.9 /100 | #82 | Exceptional 1.1% |
| Immigrants | Syria | 97.9 /100 | #83 | Exceptional 1.1% |
| Immigrants | Zaire | 97.8 /100 | #84 | Exceptional 1.1% |
| Sudanese | 97.7 /100 | #85 | Exceptional 1.1% |
| Okinawans | 97.6 /100 | #86 | Exceptional 1.1% |
| Ugandans | 97.5 /100 | #87 | Exceptional 1.1% |
| Immigrants | Dominican Republic | 97.5 /100 | #88 | Exceptional 1.1% |
| Ethiopians | 97.2 /100 | #89 | Exceptional 1.1% |
| Chinese | 97.2 /100 | #90 | Exceptional 1.1% |
| Albanians | 97.2 /100 | #91 | Exceptional 1.1% |
| Immigrants | Cuba | 97.0 /100 | #92 | Exceptional 1.1% |
| Spanish Americans | 96.9 /100 | #93 | Exceptional 1.1% |
| Sri Lankans | 96.8 /100 | #94 | Exceptional 1.1% |
| Immigrants | Moldova | 96.8 /100 | #95 | Exceptional 1.1% |
| Mongolians | 96.6 /100 | #96 | Exceptional 1.1% |