Belgian vs Immigrants from Korea Disability Age Under 5
COMPARE
Belgian
Immigrants from Korea
Disability Age Under 5
Disability Age Under 5 Comparison
Belgians
Immigrants from Korea
1.4%
DISABILITY AGE UNDER 5
0.1/ 100
METRIC RATING
268th/ 347
METRIC RANK
1.1%
DISABILITY AGE UNDER 5
98.8/ 100
METRIC RATING
65th/ 347
METRIC RANK
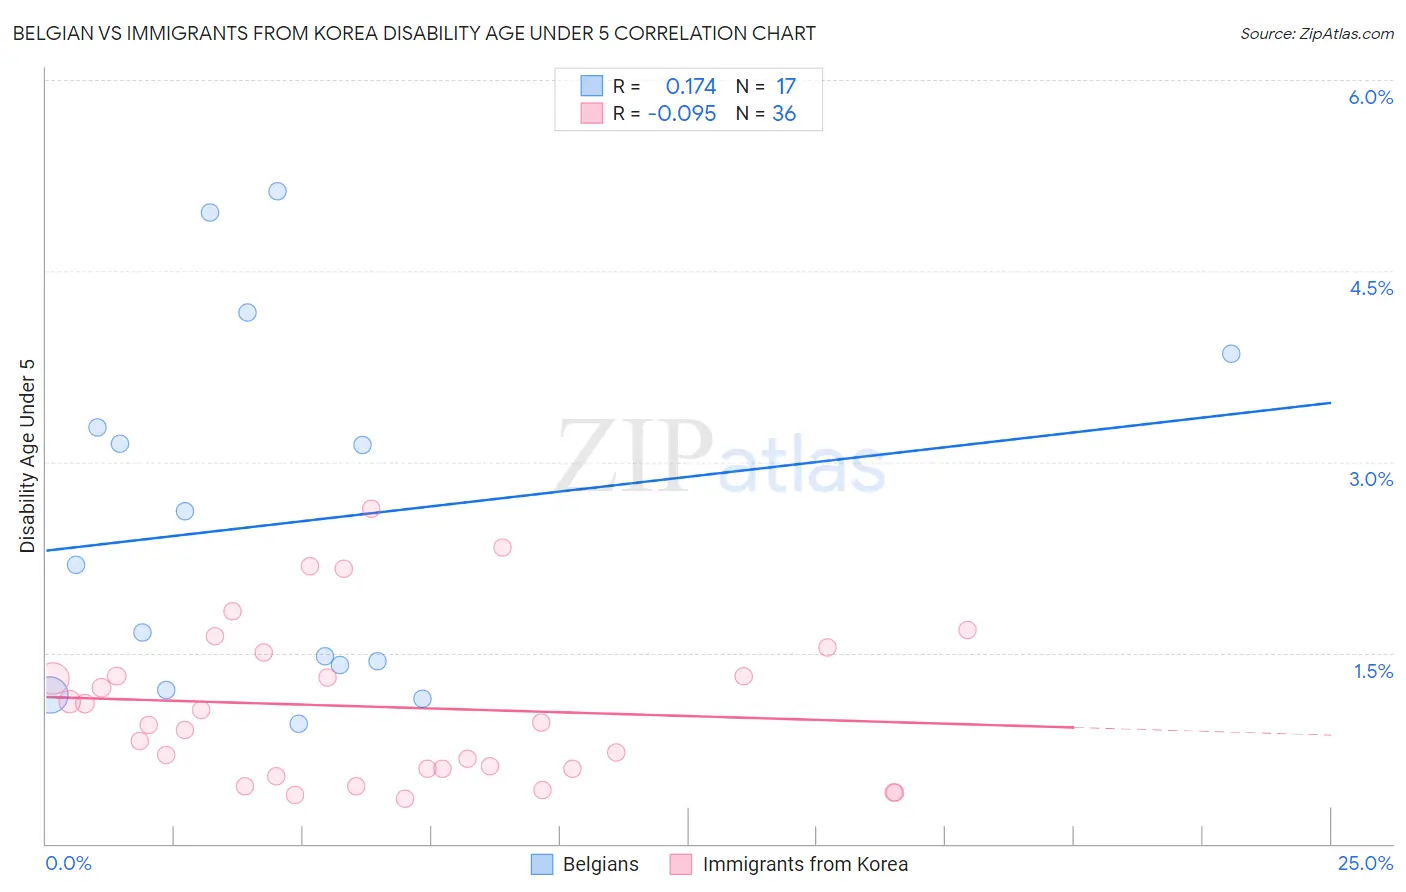
Belgian vs Immigrants from Korea Disability Age Under 5 Correlation Chart
The statistical analysis conducted on geographies consisting of 192,782,941 people shows a poor positive correlation between the proportion of Belgians and percentage of population with a disability under the age of 5 in the United States with a correlation coefficient (R) of 0.174 and weighted average of 1.4%. Similarly, the statistical analysis conducted on geographies consisting of 221,993,484 people shows a slight negative correlation between the proportion of Immigrants from Korea and percentage of population with a disability under the age of 5 in the United States with a correlation coefficient (R) of -0.095 and weighted average of 1.1%, a difference of 28.9%.
Disability Age Under 5 Correlation Summary
| Measurement | Belgian | Immigrants from Korea |
| Minimum | 0.94% | 0.35% |
| Maximum | 5.1% | 2.6% |
| Range | 4.2% | 2.3% |
| Mean | 2.5% | 1.1% |
| Median | 2.2% | 0.95% |
| Interquartile 25% (IQ1) | 1.3% | 0.59% |
| Interquartile 75% (IQ3) | 3.6% | 1.4% |
| Interquartile Range (IQR) | 2.3% | 0.82% |
| Standard Deviation (Sample) | 1.4% | 0.61% |
| Standard Deviation (Population) | 1.3% | 0.60% |
Similar Demographics by Disability Age Under 5
Demographics Similar to Belgians by Disability Age Under 5
In terms of disability age under 5, the demographic groups most similar to Belgians are Austrian (1.4%, a difference of 0.18%), Immigrants from North America (1.4%, a difference of 0.31%), Immigrants from Canada (1.4%, a difference of 0.35%), Black/African American (1.4%, a difference of 0.51%), and Cree (1.4%, a difference of 0.58%).
| Demographics | Rating | Rank | Disability Age Under 5 |
| Immigrants | Netherlands | 0.2 /100 | #261 | Tragic 1.4% |
| Immigrants | Dominica | 0.2 /100 | #262 | Tragic 1.4% |
| Spanish | 0.2 /100 | #263 | Tragic 1.4% |
| Yugoslavians | 0.1 /100 | #264 | Tragic 1.4% |
| Carpatho Rusyns | 0.1 /100 | #265 | Tragic 1.4% |
| Immigrants | Germany | 0.1 /100 | #266 | Tragic 1.4% |
| Cree | 0.1 /100 | #267 | Tragic 1.4% |
| Belgians | 0.1 /100 | #268 | Tragic 1.4% |
| Austrians | 0.1 /100 | #269 | Tragic 1.4% |
| Immigrants | North America | 0.1 /100 | #270 | Tragic 1.4% |
| Immigrants | Canada | 0.1 /100 | #271 | Tragic 1.4% |
| Blacks/African Americans | 0.1 /100 | #272 | Tragic 1.4% |
| Alaskan Athabascans | 0.1 /100 | #273 | Tragic 1.5% |
| Iroquois | 0.0 /100 | #274 | Tragic 1.5% |
| Brazilians | 0.0 /100 | #275 | Tragic 1.5% |
Demographics Similar to Immigrants from Korea by Disability Age Under 5
In terms of disability age under 5, the demographic groups most similar to Immigrants from Korea are Immigrants from Indonesia (1.1%, a difference of 0.13%), Immigrants from Belize (1.1%, a difference of 0.19%), South African (1.1%, a difference of 0.23%), Israeli (1.1%, a difference of 0.26%), and Egyptian (1.1%, a difference of 0.34%).
| Demographics | Rating | Rank | Disability Age Under 5 |
| Immigrants | Egypt | 99.4 /100 | #58 | Exceptional 1.1% |
| Immigrants | Malaysia | 99.4 /100 | #59 | Exceptional 1.1% |
| Immigrants | Western Asia | 99.2 /100 | #60 | Exceptional 1.1% |
| Immigrants | Ethiopia | 99.2 /100 | #61 | Exceptional 1.1% |
| Immigrants | Switzerland | 99.2 /100 | #62 | Exceptional 1.1% |
| Immigrants | Vietnam | 99.1 /100 | #63 | Exceptional 1.1% |
| Egyptians | 98.9 /100 | #64 | Exceptional 1.1% |
| Immigrants | Korea | 98.8 /100 | #65 | Exceptional 1.1% |
| Immigrants | Indonesia | 98.7 /100 | #66 | Exceptional 1.1% |
| Immigrants | Belize | 98.7 /100 | #67 | Exceptional 1.1% |
| South Africans | 98.7 /100 | #68 | Exceptional 1.1% |
| Israelis | 98.7 /100 | #69 | Exceptional 1.1% |
| Immigrants | Ecuador | 98.6 /100 | #70 | Exceptional 1.1% |
| Trinidadians and Tobagonians | 98.6 /100 | #71 | Exceptional 1.1% |
| Burmese | 98.5 /100 | #72 | Exceptional 1.1% |