Immigrants from Afghanistan vs Immigrants from South Eastern Asia Cognitive Disability
COMPARE
Immigrants from Afghanistan
Immigrants from South Eastern Asia
Cognitive Disability
Cognitive Disability Comparison
Immigrants from Afghanistan
Immigrants from South Eastern Asia
17.5%
COGNITIVE DISABILITY
16.7/ 100
METRIC RATING
197th/ 347
METRIC RANK
17.0%
COGNITIVE DISABILITY
88.7/ 100
METRIC RATING
145th/ 347
METRIC RANK
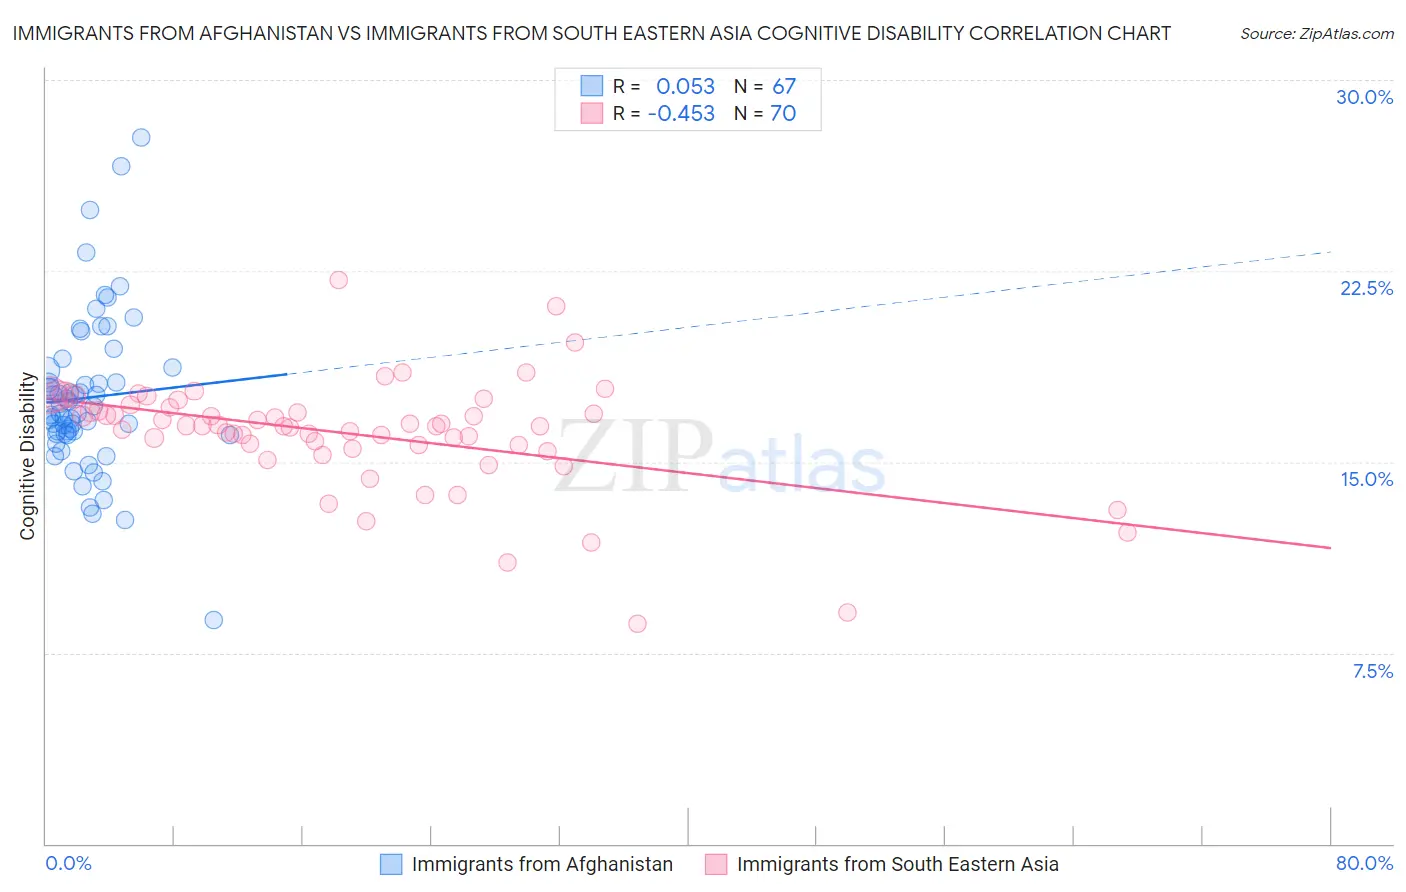
Immigrants from Afghanistan vs Immigrants from South Eastern Asia Cognitive Disability Correlation Chart
The statistical analysis conducted on geographies consisting of 147,641,735 people shows a slight positive correlation between the proportion of Immigrants from Afghanistan and percentage of population with cognitive disability in the United States with a correlation coefficient (R) of 0.053 and weighted average of 17.5%. Similarly, the statistical analysis conducted on geographies consisting of 512,576,863 people shows a moderate negative correlation between the proportion of Immigrants from South Eastern Asia and percentage of population with cognitive disability in the United States with a correlation coefficient (R) of -0.453 and weighted average of 17.0%, a difference of 2.6%.
Cognitive Disability Correlation Summary
| Measurement | Immigrants from Afghanistan | Immigrants from South Eastern Asia |
| Minimum | 8.8% | 8.6% |
| Maximum | 27.8% | 22.1% |
| Range | 19.0% | 13.5% |
| Mean | 17.5% | 16.1% |
| Median | 16.9% | 16.4% |
| Interquartile 25% (IQ1) | 16.1% | 15.6% |
| Interquartile 75% (IQ3) | 18.6% | 17.1% |
| Interquartile Range (IQR) | 2.5% | 1.5% |
| Standard Deviation (Sample) | 3.1% | 2.2% |
| Standard Deviation (Population) | 3.1% | 2.2% |
Similar Demographics by Cognitive Disability
Demographics Similar to Immigrants from Afghanistan by Cognitive Disability
In terms of cognitive disability, the demographic groups most similar to Immigrants from Afghanistan are Guyanese (17.5%, a difference of 0.040%), Immigrants from Panama (17.5%, a difference of 0.10%), Immigrants from Singapore (17.5%, a difference of 0.13%), Haitian (17.5%, a difference of 0.14%), and New Zealander (17.4%, a difference of 0.20%).
| Demographics | Rating | Rank | Cognitive Disability |
| Immigrants | Spain | 27.7 /100 | #190 | Fair 17.4% |
| Immigrants | Nonimmigrants | 27.4 /100 | #191 | Fair 17.4% |
| Immigrants | Haiti | 27.1 /100 | #192 | Fair 17.4% |
| Delaware | 25.6 /100 | #193 | Fair 17.4% |
| Immigrants | Bosnia and Herzegovina | 22.0 /100 | #194 | Fair 17.4% |
| New Zealanders | 21.1 /100 | #195 | Fair 17.4% |
| Guyanese | 17.5 /100 | #196 | Poor 17.5% |
| Immigrants | Afghanistan | 16.7 /100 | #197 | Poor 17.5% |
| Immigrants | Panama | 14.8 /100 | #198 | Poor 17.5% |
| Immigrants | Singapore | 14.3 /100 | #199 | Poor 17.5% |
| Haitians | 14.1 /100 | #200 | Poor 17.5% |
| South American Indians | 13.0 /100 | #201 | Poor 17.5% |
| Immigrants | Morocco | 12.0 /100 | #202 | Poor 17.5% |
| Immigrants | Caribbean | 11.0 /100 | #203 | Poor 17.5% |
| Immigrants | Zimbabwe | 11.0 /100 | #204 | Poor 17.5% |
Demographics Similar to Immigrants from South Eastern Asia by Cognitive Disability
In terms of cognitive disability, the demographic groups most similar to Immigrants from South Eastern Asia are British (17.0%, a difference of 0.050%), Immigrants from Brazil (17.0%, a difference of 0.050%), Costa Rican (17.0%, a difference of 0.050%), Carpatho Rusyn (17.0%, a difference of 0.070%), and Aleut (17.0%, a difference of 0.090%).
| Demographics | Rating | Rank | Cognitive Disability |
| Welsh | 90.8 /100 | #138 | Exceptional 17.0% |
| French | 90.0 /100 | #139 | Excellent 17.0% |
| Chileans | 89.9 /100 | #140 | Excellent 17.0% |
| Aleuts | 89.9 /100 | #141 | Excellent 17.0% |
| Carpatho Rusyns | 89.6 /100 | #142 | Excellent 17.0% |
| British | 89.3 /100 | #143 | Excellent 17.0% |
| Immigrants | Brazil | 89.3 /100 | #144 | Excellent 17.0% |
| Immigrants | South Eastern Asia | 88.7 /100 | #145 | Excellent 17.0% |
| Costa Ricans | 88.0 /100 | #146 | Excellent 17.0% |
| Scotch-Irish | 85.9 /100 | #147 | Excellent 17.1% |
| French Canadians | 85.7 /100 | #148 | Excellent 17.1% |
| Cypriots | 85.7 /100 | #149 | Excellent 17.1% |
| Basques | 85.5 /100 | #150 | Excellent 17.1% |
| Syrians | 83.0 /100 | #151 | Excellent 17.1% |
| Immigrants | Indonesia | 82.7 /100 | #152 | Excellent 17.1% |