Immigrants from Afghanistan vs Immigrants from Kenya 1 or more Vehicles in Household
COMPARE
Immigrants from Afghanistan
Immigrants from Kenya
1 or more Vehicles in Household
1 or more Vehicles in Household Comparison
Immigrants from Afghanistan
Immigrants from Kenya
92.0%
1 OR MORE VEHICLES IN HOUSEHOLD
99.9/ 100
METRIC RATING
55th/ 347
METRIC RANK
90.4%
1 OR MORE VEHICLES IN HOUSEHOLD
88.5/ 100
METRIC RATING
131st/ 347
METRIC RANK
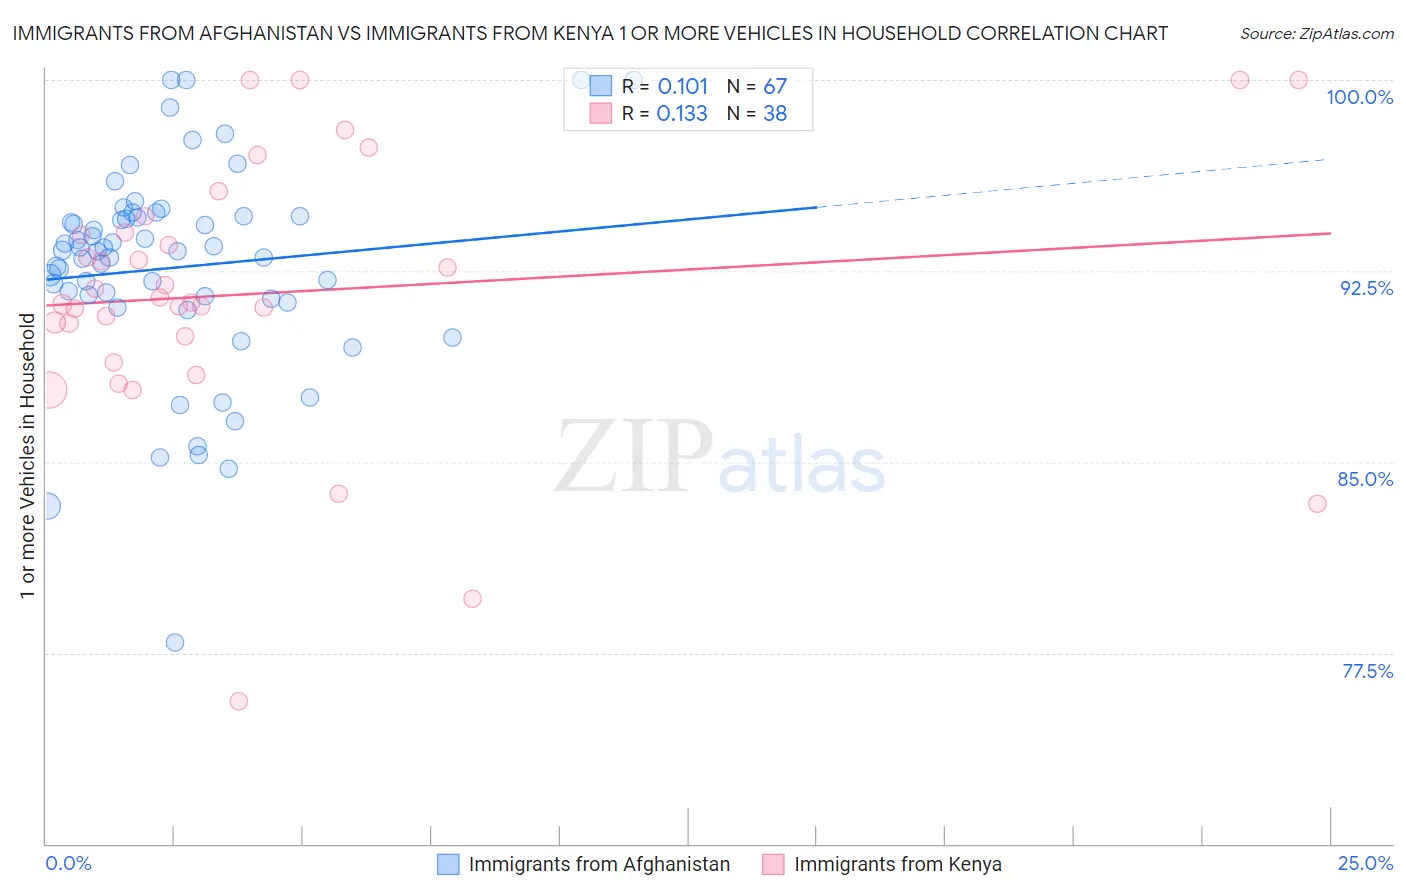
Immigrants from Afghanistan vs Immigrants from Kenya 1 or more Vehicles in Household Correlation Chart
The statistical analysis conducted on geographies consisting of 147,625,417 people shows a poor positive correlation between the proportion of Immigrants from Afghanistan and percentage of households with 1 or more vehicles available in the United States with a correlation coefficient (R) of 0.101 and weighted average of 92.0%. Similarly, the statistical analysis conducted on geographies consisting of 217,997,711 people shows a poor positive correlation between the proportion of Immigrants from Kenya and percentage of households with 1 or more vehicles available in the United States with a correlation coefficient (R) of 0.133 and weighted average of 90.4%, a difference of 1.7%.
1 or more Vehicles in Household Correlation Summary
| Measurement | Immigrants from Afghanistan | Immigrants from Kenya |
| Minimum | 77.9% | 75.6% |
| Maximum | 100.0% | 100.0% |
| Range | 22.1% | 24.4% |
| Mean | 92.6% | 91.6% |
| Median | 93.3% | 91.4% |
| Interquartile 25% (IQ1) | 91.4% | 89.9% |
| Interquartile 75% (IQ3) | 94.6% | 94.0% |
| Interquartile Range (IQR) | 3.2% | 4.1% |
| Standard Deviation (Sample) | 4.1% | 5.3% |
| Standard Deviation (Population) | 4.1% | 5.2% |
Similar Demographics by 1 or more Vehicles in Household
Demographics Similar to Immigrants from Afghanistan by 1 or more Vehicles in Household
In terms of 1 or more vehicles in household, the demographic groups most similar to Immigrants from Afghanistan are Immigrants from Venezuela (92.0%, a difference of 0.0%), Iraqi (91.9%, a difference of 0.040%), Slovene (92.0%, a difference of 0.060%), Immigrants from Mexico (91.9%, a difference of 0.060%), and Hawaiian (92.0%, a difference of 0.070%).
| Demographics | Rating | Rank | 1 or more Vehicles in Household |
| Belgians | 99.9 /100 | #48 | Exceptional 92.1% |
| Afghans | 99.9 /100 | #49 | Exceptional 92.1% |
| Guamanians/Chamorros | 99.9 /100 | #50 | Exceptional 92.1% |
| Celtics | 99.9 /100 | #51 | Exceptional 92.1% |
| Koreans | 99.9 /100 | #52 | Exceptional 92.1% |
| Hawaiians | 99.9 /100 | #53 | Exceptional 92.0% |
| Slovenes | 99.9 /100 | #54 | Exceptional 92.0% |
| Immigrants | Afghanistan | 99.9 /100 | #55 | Exceptional 92.0% |
| Immigrants | Venezuela | 99.9 /100 | #56 | Exceptional 92.0% |
| Iraqis | 99.8 /100 | #57 | Exceptional 91.9% |
| Immigrants | Mexico | 99.8 /100 | #58 | Exceptional 91.9% |
| Venezuelans | 99.8 /100 | #59 | Exceptional 91.9% |
| Slovaks | 99.8 /100 | #60 | Exceptional 91.9% |
| Immigrants | India | 99.8 /100 | #61 | Exceptional 91.9% |
| Thais | 99.8 /100 | #62 | Exceptional 91.9% |
Demographics Similar to Immigrants from Kenya by 1 or more Vehicles in Household
In terms of 1 or more vehicles in household, the demographic groups most similar to Immigrants from Kenya are Nicaraguan (90.4%, a difference of 0.010%), Immigrants from South Africa (90.4%, a difference of 0.010%), Immigrants from the Azores (90.4%, a difference of 0.020%), Burmese (90.4%, a difference of 0.020%), and Marshallese (90.4%, a difference of 0.020%).
| Demographics | Rating | Rank | 1 or more Vehicles in Household |
| Puget Sound Salish | 91.5 /100 | #124 | Exceptional 90.5% |
| Immigrants | Korea | 90.5 /100 | #125 | Exceptional 90.5% |
| Immigrants | Cameroon | 89.4 /100 | #126 | Excellent 90.4% |
| Immigrants | Azores | 89.1 /100 | #127 | Excellent 90.4% |
| Burmese | 89.0 /100 | #128 | Excellent 90.4% |
| Marshallese | 88.9 /100 | #129 | Excellent 90.4% |
| Nicaraguans | 88.8 /100 | #130 | Excellent 90.4% |
| Immigrants | Kenya | 88.5 /100 | #131 | Excellent 90.4% |
| Immigrants | South Africa | 88.1 /100 | #132 | Excellent 90.4% |
| Immigrants | Syria | 87.5 /100 | #133 | Excellent 90.4% |
| Kenyans | 87.0 /100 | #134 | Excellent 90.4% |
| Immigrants | Oceania | 86.9 /100 | #135 | Excellent 90.4% |
| Hungarians | 86.5 /100 | #136 | Excellent 90.3% |
| Latvians | 86.3 /100 | #137 | Excellent 90.3% |
| Syrians | 86.3 /100 | #138 | Excellent 90.3% |