Immigrants from Afghanistan vs Tlingit-Haida Cognitive Disability
COMPARE
Immigrants from Afghanistan
Tlingit-Haida
Cognitive Disability
Cognitive Disability Comparison
Immigrants from Afghanistan
Tlingit-Haida
17.5%
COGNITIVE DISABILITY
16.7/ 100
METRIC RATING
197th/ 347
METRIC RANK
17.2%
COGNITIVE DISABILITY
59.4/ 100
METRIC RATING
171st/ 347
METRIC RANK
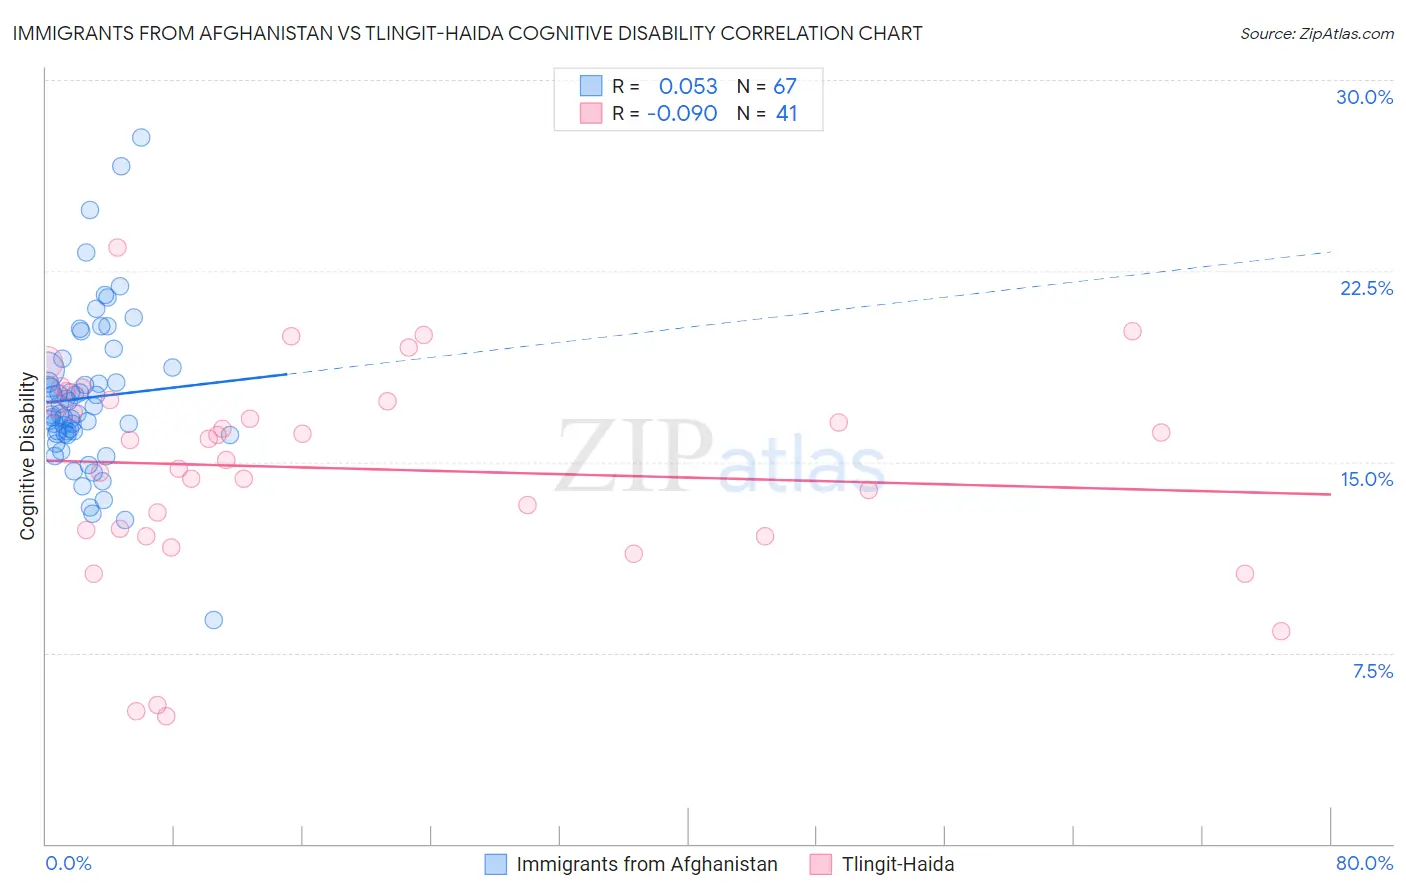
Immigrants from Afghanistan vs Tlingit-Haida Cognitive Disability Correlation Chart
The statistical analysis conducted on geographies consisting of 147,641,735 people shows a slight positive correlation between the proportion of Immigrants from Afghanistan and percentage of population with cognitive disability in the United States with a correlation coefficient (R) of 0.053 and weighted average of 17.5%. Similarly, the statistical analysis conducted on geographies consisting of 60,855,402 people shows a slight negative correlation between the proportion of Tlingit-Haida and percentage of population with cognitive disability in the United States with a correlation coefficient (R) of -0.090 and weighted average of 17.2%, a difference of 1.4%.
Cognitive Disability Correlation Summary
| Measurement | Immigrants from Afghanistan | Tlingit-Haida |
| Minimum | 8.8% | 5.0% |
| Maximum | 27.8% | 23.4% |
| Range | 19.0% | 18.4% |
| Mean | 17.5% | 14.7% |
| Median | 16.9% | 15.9% |
| Interquartile 25% (IQ1) | 16.1% | 12.2% |
| Interquartile 75% (IQ3) | 18.6% | 17.4% |
| Interquartile Range (IQR) | 2.5% | 5.2% |
| Standard Deviation (Sample) | 3.1% | 4.1% |
| Standard Deviation (Population) | 3.1% | 4.0% |
Similar Demographics by Cognitive Disability
Demographics Similar to Immigrants from Afghanistan by Cognitive Disability
In terms of cognitive disability, the demographic groups most similar to Immigrants from Afghanistan are Guyanese (17.5%, a difference of 0.040%), Immigrants from Panama (17.5%, a difference of 0.10%), Immigrants from Singapore (17.5%, a difference of 0.13%), Haitian (17.5%, a difference of 0.14%), and New Zealander (17.4%, a difference of 0.20%).
| Demographics | Rating | Rank | Cognitive Disability |
| Immigrants | Spain | 27.7 /100 | #190 | Fair 17.4% |
| Immigrants | Nonimmigrants | 27.4 /100 | #191 | Fair 17.4% |
| Immigrants | Haiti | 27.1 /100 | #192 | Fair 17.4% |
| Delaware | 25.6 /100 | #193 | Fair 17.4% |
| Immigrants | Bosnia and Herzegovina | 22.0 /100 | #194 | Fair 17.4% |
| New Zealanders | 21.1 /100 | #195 | Fair 17.4% |
| Guyanese | 17.5 /100 | #196 | Poor 17.5% |
| Immigrants | Afghanistan | 16.7 /100 | #197 | Poor 17.5% |
| Immigrants | Panama | 14.8 /100 | #198 | Poor 17.5% |
| Immigrants | Singapore | 14.3 /100 | #199 | Poor 17.5% |
| Haitians | 14.1 /100 | #200 | Poor 17.5% |
| South American Indians | 13.0 /100 | #201 | Poor 17.5% |
| Immigrants | Morocco | 12.0 /100 | #202 | Poor 17.5% |
| Immigrants | Caribbean | 11.0 /100 | #203 | Poor 17.5% |
| Immigrants | Zimbabwe | 11.0 /100 | #204 | Poor 17.5% |
Demographics Similar to Tlingit-Haida by Cognitive Disability
In terms of cognitive disability, the demographic groups most similar to Tlingit-Haida are Ecuadorian (17.2%, a difference of 0.0%), Immigrants from Portugal (17.2%, a difference of 0.070%), Immigrants from Turkey (17.2%, a difference of 0.080%), Immigrants (17.2%, a difference of 0.090%), and Immigrants from Syria (17.2%, a difference of 0.12%).
| Demographics | Rating | Rank | Cognitive Disability |
| Armenians | 70.1 /100 | #164 | Good 17.2% |
| Immigrants | Albania | 64.9 /100 | #165 | Good 17.2% |
| Immigrants | Ecuador | 64.4 /100 | #166 | Good 17.2% |
| Immigrants | Syria | 63.5 /100 | #167 | Good 17.2% |
| Immigrants | Immigrants | 62.5 /100 | #168 | Good 17.2% |
| Immigrants | Portugal | 61.8 /100 | #169 | Good 17.2% |
| Ecuadorians | 59.6 /100 | #170 | Average 17.2% |
| Tlingit-Haida | 59.4 /100 | #171 | Average 17.2% |
| Immigrants | Turkey | 56.7 /100 | #172 | Average 17.2% |
| Immigrants | Northern Africa | 50.2 /100 | #173 | Average 17.3% |
| Laotians | 50.0 /100 | #174 | Average 17.3% |
| Tsimshian | 49.8 /100 | #175 | Average 17.3% |
| Shoshone | 49.2 /100 | #176 | Average 17.3% |
| Ute | 49.1 /100 | #177 | Average 17.3% |
| Spanish | 48.9 /100 | #178 | Average 17.3% |