Immigrants from Afghanistan vs Immigrants from Kenya Unemployment Among Seniors over 75 years
COMPARE
Immigrants from Afghanistan
Immigrants from Kenya
Unemployment Among Seniors over 75 years
Unemployment Among Seniors over 75 years Comparison
Immigrants from Afghanistan
Immigrants from Kenya
8.8%
UNEMPLOYMENT AMONG SENIORS OVER 75 YEARS
38.2/ 100
METRIC RATING
183rd/ 347
METRIC RANK
8.8%
UNEMPLOYMENT AMONG SENIORS OVER 75 YEARS
31.8/ 100
METRIC RATING
192nd/ 347
METRIC RANK
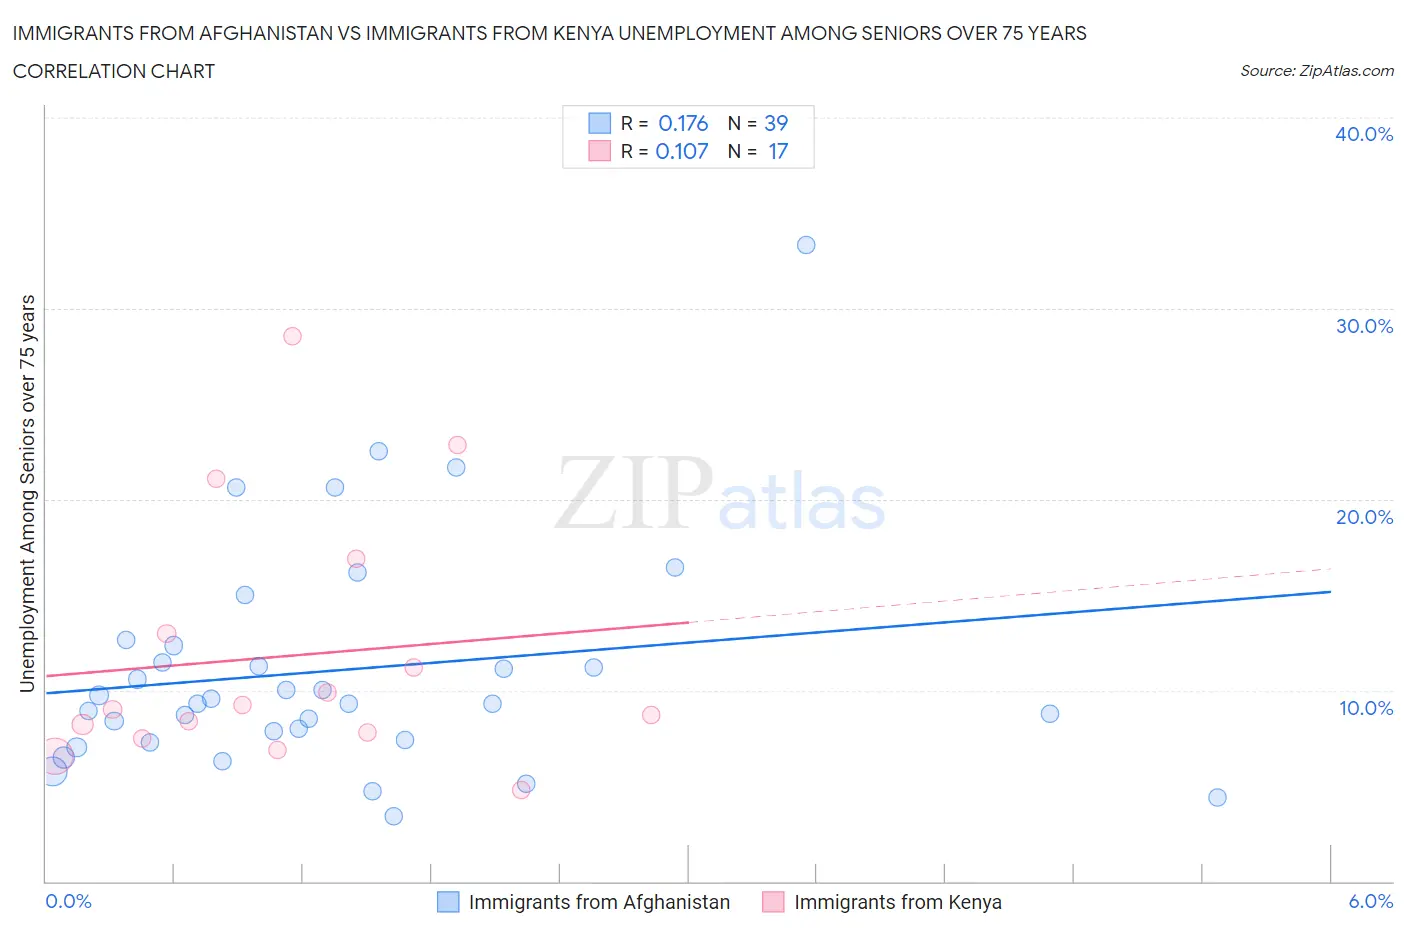
Immigrants from Afghanistan vs Immigrants from Kenya Unemployment Among Seniors over 75 years Correlation Chart
The statistical analysis conducted on geographies consisting of 104,547,909 people shows a poor positive correlation between the proportion of Immigrants from Afghanistan and unemployment rate among seniors over the age of 75 in the United States with a correlation coefficient (R) of 0.176 and weighted average of 8.8%. Similarly, the statistical analysis conducted on geographies consisting of 135,447,825 people shows a poor positive correlation between the proportion of Immigrants from Kenya and unemployment rate among seniors over the age of 75 in the United States with a correlation coefficient (R) of 0.107 and weighted average of 8.8%, a difference of 0.38%.
Unemployment Among Seniors over 75 years Correlation Summary
| Measurement | Immigrants from Afghanistan | Immigrants from Kenya |
| Minimum | 3.4% | 4.8% |
| Maximum | 33.3% | 28.6% |
| Range | 29.9% | 23.8% |
| Mean | 11.1% | 11.8% |
| Median | 9.3% | 9.0% |
| Interquartile 25% (IQ1) | 7.4% | 7.6% |
| Interquartile 75% (IQ3) | 12.3% | 14.9% |
| Interquartile Range (IQR) | 4.9% | 7.3% |
| Standard Deviation (Sample) | 6.0% | 6.6% |
| Standard Deviation (Population) | 5.9% | 6.4% |
Demographics Similar to Immigrants from Afghanistan and Immigrants from Kenya by Unemployment Among Seniors over 75 years
In terms of unemployment among seniors over 75 years, the demographic groups most similar to Immigrants from Afghanistan are Immigrants from Micronesia (8.8%, a difference of 0.060%), Choctaw (8.8%, a difference of 0.060%), Guatemalan (8.8%, a difference of 0.070%), Immigrants from Thailand (8.8%, a difference of 0.11%), and Immigrants from Ethiopia (8.8%, a difference of 0.12%). Similarly, the demographic groups most similar to Immigrants from Kenya are Estonian (8.8%, a difference of 0.090%), Immigrants from Guyana (8.8%, a difference of 0.12%), Mexican American Indian (8.8%, a difference of 0.17%), Maltese (8.8%, a difference of 0.17%), and Immigrants from Eastern Europe (8.8%, a difference of 0.18%).
| Demographics | Rating | Rank | Unemployment Among Seniors over 75 years |
| Central Americans | 43.3 /100 | #177 | Average 8.8% |
| West Indians | 41.9 /100 | #178 | Average 8.8% |
| Immigrants | Italy | 41.7 /100 | #179 | Average 8.8% |
| Immigrants | Somalia | 41.7 /100 | #180 | Average 8.8% |
| Immigrants | Thailand | 40.2 /100 | #181 | Average 8.8% |
| Guatemalans | 39.5 /100 | #182 | Fair 8.8% |
| Immigrants | Afghanistan | 38.2 /100 | #183 | Fair 8.8% |
| Immigrants | Micronesia | 37.2 /100 | #184 | Fair 8.8% |
| Choctaw | 37.1 /100 | #185 | Fair 8.8% |
| Immigrants | Ethiopia | 36.2 /100 | #186 | Fair 8.8% |
| Immigrants | Europe | 35.2 /100 | #187 | Fair 8.8% |
| Immigrants | Eastern Europe | 34.7 /100 | #188 | Fair 8.8% |
| Immigrants | Haiti | 34.7 /100 | #189 | Fair 8.8% |
| Mexican American Indians | 34.7 /100 | #190 | Fair 8.8% |
| Estonians | 33.3 /100 | #191 | Fair 8.8% |
| Immigrants | Kenya | 31.8 /100 | #192 | Fair 8.8% |
| Immigrants | Guyana | 29.9 /100 | #193 | Fair 8.8% |
| Maltese | 29.2 /100 | #194 | Fair 8.8% |
| Okinawans | 28.9 /100 | #195 | Fair 8.8% |
| Immigrants | Jamaica | 27.7 /100 | #196 | Fair 8.9% |
| Immigrants | Laos | 26.3 /100 | #197 | Fair 8.9% |