Icelander vs Hawaiian Hearing Disability
COMPARE
Icelander
Hawaiian
Hearing Disability
Hearing Disability Comparison
Icelanders
Hawaiians
3.2%
HEARING DISABILITY
5.2/ 100
METRIC RATING
224th/ 347
METRIC RANK
3.5%
HEARING DISABILITY
0.1/ 100
METRIC RATING
261st/ 347
METRIC RANK
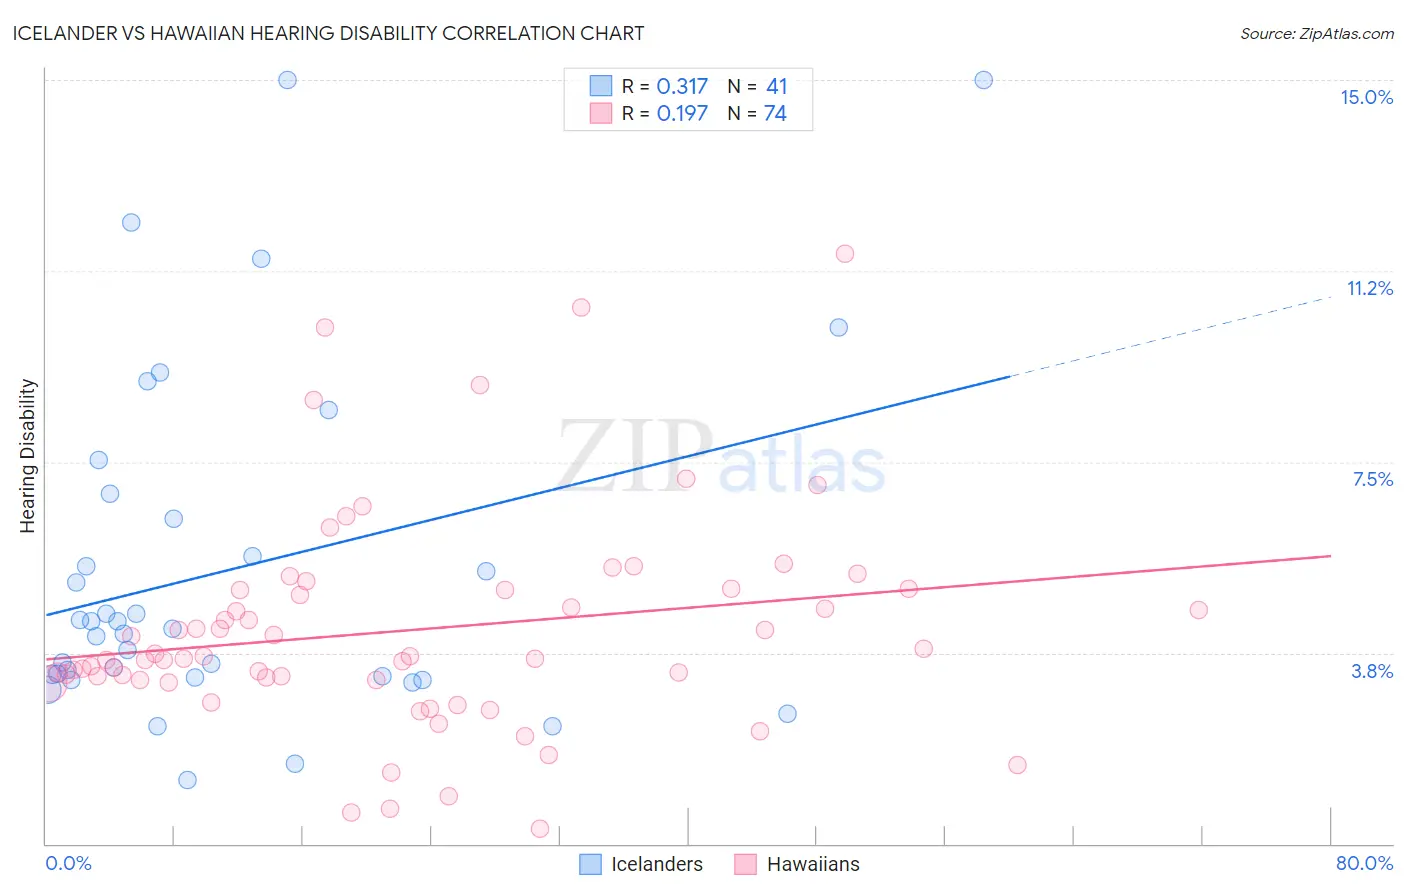
Icelander vs Hawaiian Hearing Disability Correlation Chart
The statistical analysis conducted on geographies consisting of 159,637,999 people shows a mild positive correlation between the proportion of Icelanders and percentage of population with hearing disability in the United States with a correlation coefficient (R) of 0.317 and weighted average of 3.2%. Similarly, the statistical analysis conducted on geographies consisting of 327,393,622 people shows a poor positive correlation between the proportion of Hawaiians and percentage of population with hearing disability in the United States with a correlation coefficient (R) of 0.197 and weighted average of 3.5%, a difference of 8.2%.
Hearing Disability Correlation Summary
| Measurement | Icelander | Hawaiian |
| Minimum | 1.3% | 0.29% |
| Maximum | 15.0% | 11.6% |
| Range | 13.7% | 11.3% |
| Mean | 5.4% | 4.2% |
| Median | 4.2% | 3.7% |
| Interquartile 25% (IQ1) | 3.3% | 3.2% |
| Interquartile 75% (IQ3) | 6.6% | 5.0% |
| Interquartile Range (IQR) | 3.4% | 1.8% |
| Standard Deviation (Sample) | 3.4% | 2.1% |
| Standard Deviation (Population) | 3.3% | 2.1% |
Similar Demographics by Hearing Disability
Demographics Similar to Icelanders by Hearing Disability
In terms of hearing disability, the demographic groups most similar to Icelanders are Latvian (3.2%, a difference of 0.040%), Lebanese (3.2%, a difference of 0.090%), Mexican (3.2%, a difference of 0.17%), Bhutanese (3.2%, a difference of 0.27%), and Immigrants from Portugal (3.2%, a difference of 0.47%).
| Demographics | Rating | Rank | Hearing Disability |
| Russians | 7.1 /100 | #217 | Tragic 3.2% |
| Immigrants | Northern Europe | 7.0 /100 | #218 | Tragic 3.2% |
| New Zealanders | 6.8 /100 | #219 | Tragic 3.2% |
| Malaysians | 6.6 /100 | #220 | Tragic 3.2% |
| Immigrants | Laos | 6.6 /100 | #221 | Tragic 3.2% |
| Immigrants | Oceania | 6.5 /100 | #222 | Tragic 3.2% |
| Mexicans | 5.6 /100 | #223 | Tragic 3.2% |
| Icelanders | 5.2 /100 | #224 | Tragic 3.2% |
| Latvians | 5.1 /100 | #225 | Tragic 3.2% |
| Lebanese | 5.0 /100 | #226 | Tragic 3.2% |
| Bhutanese | 4.6 /100 | #227 | Tragic 3.2% |
| Immigrants | Portugal | 4.3 /100 | #228 | Tragic 3.2% |
| Maltese | 4.1 /100 | #229 | Tragic 3.2% |
| Greeks | 3.2 /100 | #230 | Tragic 3.2% |
| Luxembourgers | 2.9 /100 | #231 | Tragic 3.2% |
Demographics Similar to Hawaiians by Hearing Disability
In terms of hearing disability, the demographic groups most similar to Hawaiians are Portuguese (3.5%, a difference of 0.040%), Slovene (3.5%, a difference of 0.11%), Immigrants from North America (3.5%, a difference of 0.11%), Immigrants from Canada (3.5%, a difference of 0.16%), and Northern European (3.4%, a difference of 0.35%).
| Demographics | Rating | Rank | Hearing Disability |
| Slavs | 0.2 /100 | #254 | Tragic 3.4% |
| Poles | 0.2 /100 | #255 | Tragic 3.4% |
| Hmong | 0.2 /100 | #256 | Tragic 3.4% |
| Yaqui | 0.2 /100 | #257 | Tragic 3.4% |
| Northern Europeans | 0.2 /100 | #258 | Tragic 3.4% |
| Slovenes | 0.1 /100 | #259 | Tragic 3.5% |
| Portuguese | 0.1 /100 | #260 | Tragic 3.5% |
| Hawaiians | 0.1 /100 | #261 | Tragic 3.5% |
| Immigrants | North America | 0.1 /100 | #262 | Tragic 3.5% |
| Immigrants | Canada | 0.1 /100 | #263 | Tragic 3.5% |
| Immigrants | Germany | 0.1 /100 | #264 | Tragic 3.5% |
| British | 0.1 /100 | #265 | Tragic 3.5% |
| Belgians | 0.1 /100 | #266 | Tragic 3.5% |
| Canadians | 0.1 /100 | #267 | Tragic 3.5% |
| Spaniards | 0.1 /100 | #268 | Tragic 3.5% |