Bahamian vs Immigrants from Ecuador Cognitive Disability
COMPARE
Bahamian
Immigrants from Ecuador
Cognitive Disability
Cognitive Disability Comparison
Bahamians
Immigrants from Ecuador
17.9%
COGNITIVE DISABILITY
0.6/ 100
METRIC RATING
256th/ 347
METRIC RANK
17.2%
COGNITIVE DISABILITY
64.4/ 100
METRIC RATING
166th/ 347
METRIC RANK
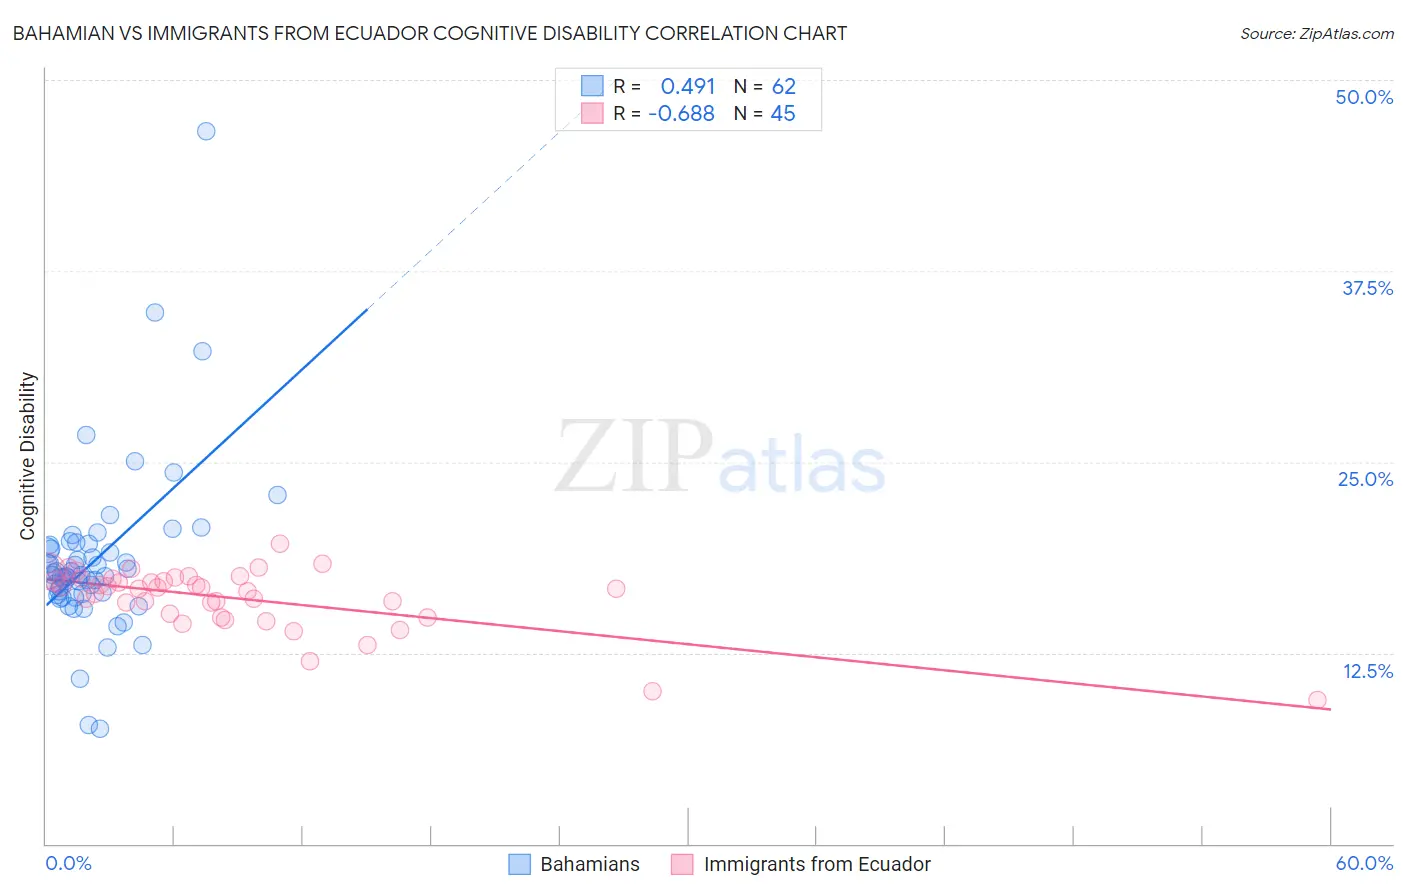
Bahamian vs Immigrants from Ecuador Cognitive Disability Correlation Chart
The statistical analysis conducted on geographies consisting of 112,674,908 people shows a moderate positive correlation between the proportion of Bahamians and percentage of population with cognitive disability in the United States with a correlation coefficient (R) of 0.491 and weighted average of 17.9%. Similarly, the statistical analysis conducted on geographies consisting of 270,972,239 people shows a significant negative correlation between the proportion of Immigrants from Ecuador and percentage of population with cognitive disability in the United States with a correlation coefficient (R) of -0.688 and weighted average of 17.2%, a difference of 4.1%.
Cognitive Disability Correlation Summary
| Measurement | Bahamian | Immigrants from Ecuador |
| Minimum | 7.5% | 9.4% |
| Maximum | 46.6% | 19.7% |
| Range | 39.1% | 10.3% |
| Mean | 18.6% | 16.1% |
| Median | 17.6% | 16.7% |
| Interquartile 25% (IQ1) | 16.4% | 14.9% |
| Interquartile 75% (IQ3) | 19.6% | 17.3% |
| Interquartile Range (IQR) | 3.2% | 2.4% |
| Standard Deviation (Sample) | 5.6% | 2.0% |
| Standard Deviation (Population) | 5.6% | 2.0% |
Similar Demographics by Cognitive Disability
Demographics Similar to Bahamians by Cognitive Disability
In terms of cognitive disability, the demographic groups most similar to Bahamians are Immigrants from the Azores (17.9%, a difference of 0.0%), Hopi (17.9%, a difference of 0.010%), Hispanic or Latino (17.9%, a difference of 0.010%), Immigrants from Grenada (17.9%, a difference of 0.020%), and Malaysian (17.9%, a difference of 0.030%).
| Demographics | Rating | Rank | Cognitive Disability |
| Cree | 0.7 /100 | #249 | Tragic 17.9% |
| Immigrants | Ethiopia | 0.7 /100 | #250 | Tragic 17.9% |
| Malaysians | 0.6 /100 | #251 | Tragic 17.9% |
| Immigrants | Grenada | 0.6 /100 | #252 | Tragic 17.9% |
| Hopi | 0.6 /100 | #253 | Tragic 17.9% |
| Hispanics or Latinos | 0.6 /100 | #254 | Tragic 17.9% |
| Immigrants | Azores | 0.6 /100 | #255 | Tragic 17.9% |
| Bahamians | 0.6 /100 | #256 | Tragic 17.9% |
| Mexican American Indians | 0.6 /100 | #257 | Tragic 17.9% |
| Immigrants | Armenia | 0.6 /100 | #258 | Tragic 17.9% |
| Ethiopians | 0.5 /100 | #259 | Tragic 17.9% |
| Immigrants | Belize | 0.5 /100 | #260 | Tragic 17.9% |
| Guamanians/Chamorros | 0.5 /100 | #261 | Tragic 17.9% |
| Sierra Leoneans | 0.4 /100 | #262 | Tragic 17.9% |
| Immigrants | Barbados | 0.4 /100 | #263 | Tragic 17.9% |
Demographics Similar to Immigrants from Ecuador by Cognitive Disability
In terms of cognitive disability, the demographic groups most similar to Immigrants from Ecuador are Immigrants from Albania (17.2%, a difference of 0.010%), Immigrants from Syria (17.2%, a difference of 0.030%), Immigrants (17.2%, a difference of 0.060%), Immigrants from Portugal (17.2%, a difference of 0.080%), and Ecuadorian (17.2%, a difference of 0.15%).
| Demographics | Rating | Rank | Cognitive Disability |
| Immigrants | Latvia | 73.2 /100 | #159 | Good 17.2% |
| Australians | 72.4 /100 | #160 | Good 17.2% |
| Americans | 72.2 /100 | #161 | Good 17.2% |
| Yugoslavians | 71.6 /100 | #162 | Good 17.2% |
| Immigrants | Switzerland | 71.5 /100 | #163 | Good 17.2% |
| Armenians | 70.1 /100 | #164 | Good 17.2% |
| Immigrants | Albania | 64.9 /100 | #165 | Good 17.2% |
| Immigrants | Ecuador | 64.4 /100 | #166 | Good 17.2% |
| Immigrants | Syria | 63.5 /100 | #167 | Good 17.2% |
| Immigrants | Immigrants | 62.5 /100 | #168 | Good 17.2% |
| Immigrants | Portugal | 61.8 /100 | #169 | Good 17.2% |
| Ecuadorians | 59.6 /100 | #170 | Average 17.2% |
| Tlingit-Haida | 59.4 /100 | #171 | Average 17.2% |
| Immigrants | Turkey | 56.7 /100 | #172 | Average 17.2% |
| Immigrants | Northern Africa | 50.2 /100 | #173 | Average 17.3% |