Houma vs Burmese Hearing Disability
COMPARE
Houma
Burmese
Hearing Disability
Hearing Disability Comparison
Houma
Burmese
4.2%
HEARING DISABILITY
0.0/ 100
METRIC RATING
332nd/ 347
METRIC RANK
2.8%
HEARING DISABILITY
94.2/ 100
METRIC RATING
104th/ 347
METRIC RANK
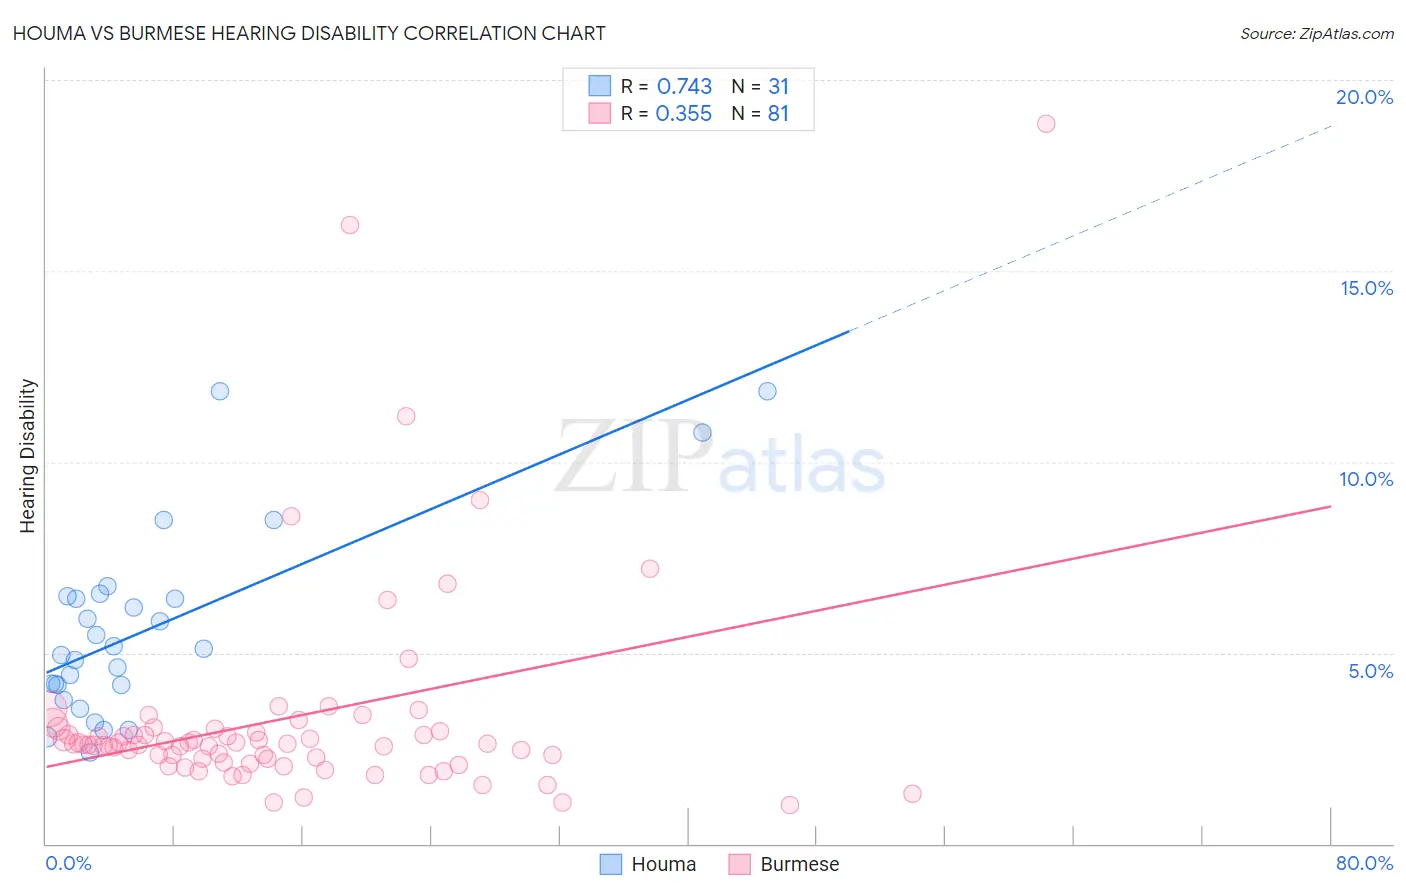
Houma vs Burmese Hearing Disability Correlation Chart
The statistical analysis conducted on geographies consisting of 36,798,453 people shows a strong positive correlation between the proportion of Houma and percentage of population with hearing disability in the United States with a correlation coefficient (R) of 0.743 and weighted average of 4.2%. Similarly, the statistical analysis conducted on geographies consisting of 465,070,150 people shows a mild positive correlation between the proportion of Burmese and percentage of population with hearing disability in the United States with a correlation coefficient (R) of 0.355 and weighted average of 2.8%, a difference of 51.2%.
Hearing Disability Correlation Summary
| Measurement | Houma | Burmese |
| Minimum | 2.4% | 1.0% |
| Maximum | 11.9% | 18.9% |
| Range | 9.5% | 17.8% |
| Mean | 5.6% | 3.3% |
| Median | 5.1% | 2.6% |
| Interquartile 25% (IQ1) | 4.1% | 2.2% |
| Interquartile 75% (IQ3) | 6.5% | 3.0% |
| Interquartile Range (IQR) | 2.3% | 0.80% |
| Standard Deviation (Sample) | 2.5% | 2.8% |
| Standard Deviation (Population) | 2.4% | 2.8% |
Similar Demographics by Hearing Disability
Demographics Similar to Houma by Hearing Disability
In terms of hearing disability, the demographic groups most similar to Houma are Dutch West Indian (4.3%, a difference of 0.59%), Cherokee (4.2%, a difference of 0.68%), Native/Alaskan (4.2%, a difference of 0.83%), Aleut (4.3%, a difference of 1.1%), and Crow (4.2%, a difference of 1.6%).
| Demographics | Rating | Rank | Hearing Disability |
| Lumbee | 0.0 /100 | #325 | Tragic 4.1% |
| Potawatomi | 0.0 /100 | #326 | Tragic 4.1% |
| Arapaho | 0.0 /100 | #327 | Tragic 4.1% |
| Tohono O'odham | 0.0 /100 | #328 | Tragic 4.2% |
| Crow | 0.0 /100 | #329 | Tragic 4.2% |
| Natives/Alaskans | 0.0 /100 | #330 | Tragic 4.2% |
| Cherokee | 0.0 /100 | #331 | Tragic 4.2% |
| Houma | 0.0 /100 | #332 | Tragic 4.2% |
| Dutch West Indians | 0.0 /100 | #333 | Tragic 4.3% |
| Aleuts | 0.0 /100 | #334 | Tragic 4.3% |
| Kiowa | 0.0 /100 | #335 | Tragic 4.3% |
| Creek | 0.0 /100 | #336 | Tragic 4.4% |
| Chickasaw | 0.0 /100 | #337 | Tragic 4.5% |
| Alaska Natives | 0.0 /100 | #338 | Tragic 4.5% |
| Choctaw | 0.0 /100 | #339 | Tragic 4.5% |
Demographics Similar to Burmese by Hearing Disability
In terms of hearing disability, the demographic groups most similar to Burmese are Moroccan (2.8%, a difference of 0.11%), Immigrants from Indonesia (2.8%, a difference of 0.27%), Taiwanese (2.8%, a difference of 0.32%), Immigrants from Spain (2.8%, a difference of 0.33%), and Honduran (2.8%, a difference of 0.35%).
| Demographics | Rating | Rank | Hearing Disability |
| Immigrants | Afghanistan | 95.3 /100 | #97 | Exceptional 2.8% |
| Immigrants | Honduras | 95.1 /100 | #98 | Exceptional 2.8% |
| Immigrants | Guatemala | 95.1 /100 | #99 | Exceptional 2.8% |
| Immigrants | Eastern Africa | 95.0 /100 | #100 | Exceptional 2.8% |
| Immigrants | Spain | 94.9 /100 | #101 | Exceptional 2.8% |
| Taiwanese | 94.8 /100 | #102 | Exceptional 2.8% |
| Immigrants | Indonesia | 94.7 /100 | #103 | Exceptional 2.8% |
| Burmese | 94.2 /100 | #104 | Exceptional 2.8% |
| Moroccans | 93.9 /100 | #105 | Exceptional 2.8% |
| Hondurans | 93.4 /100 | #106 | Exceptional 2.8% |
| Immigrants | Chile | 93.4 /100 | #107 | Exceptional 2.8% |
| Guatemalans | 93.2 /100 | #108 | Exceptional 2.8% |
| Turks | 93.0 /100 | #109 | Exceptional 2.8% |
| Cypriots | 92.9 /100 | #110 | Exceptional 2.8% |
| Immigrants | Yemen | 92.7 /100 | #111 | Exceptional 2.8% |